What's new for July 2024?
Shift Left Converter: Difference Viewer
You can now compare the original LoadRunner test code with the YAML file generated by the converter. This feature enhances the debugging process by allowing customers to easily understand the changes made during conversion.
[Service Virtualization]: Enhanced Import/Export
The Import and Export functionality for Services now supports Test Data models. Exporting a Service generates a ZIP file containing the transaction data and any associated test data. Importing this ZIP file into Service Virtualization will restore the transactions and their test data.
[Service Virtualization]: Changed Mock References
As announced earlier this year, the component previously known as Mock Service has been renamed to Service Virtualization. All UI references now reflect this change, with Mock Service now labeled as Virtual Service. The Service entity remains unchanged. Additionally, the option for creating Private Locations now displays Service Virtualization instead of Mock Services.
[Service Virtualization]: Rename a Virtual Service
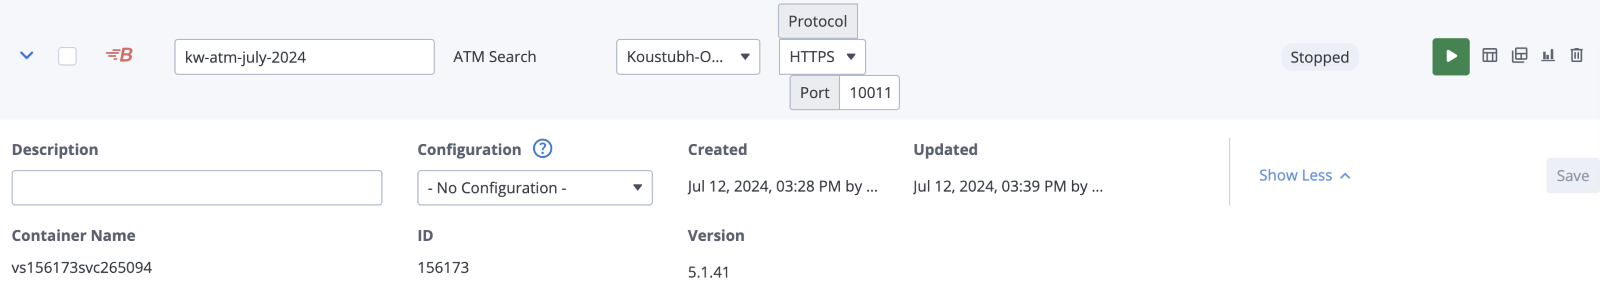
You can now rename a virtual service when it is stopped. This changes the display name of the virtual service but not the container name. Click "Show More" to view the container name, container ID, and version.
[Service Virtualization]: Update Location of Virtual Service
When a virtual service is stopped, users can change its location from one private location to another. This redeploys the virtual service to a new OPL and removes the existing container and its logs from the old OPL.
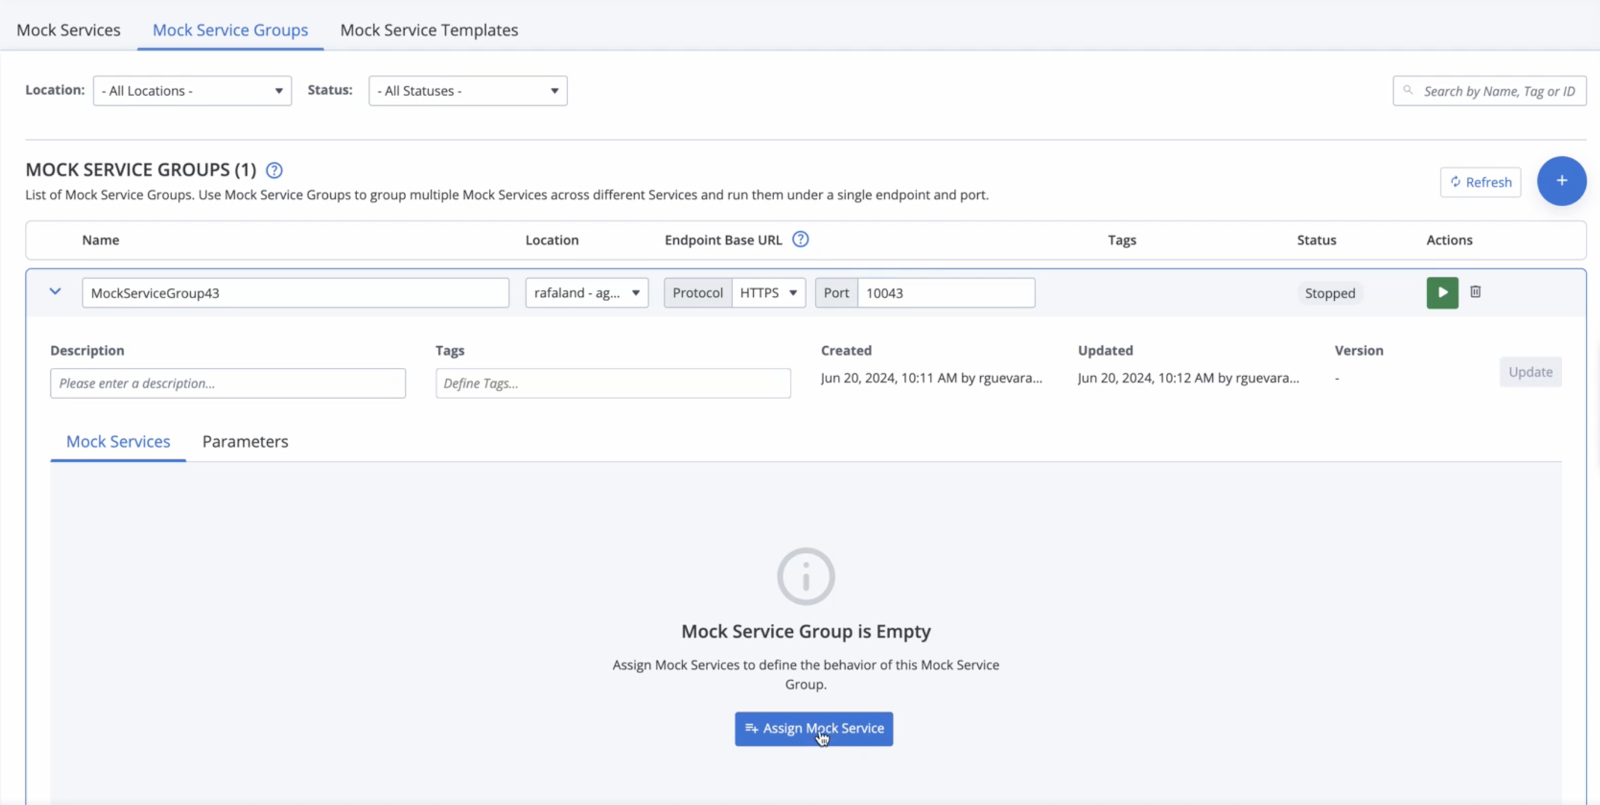
[Service Virtualization]: Deploy Multiple Virtual Services on a Single Port
To address security concerns about exposing numerous ports, we have introduced virtual service groups. Multiple virtual services can now be accessed through a single port by creating a virtual service group. For example, 20 virtual services can be grouped under "myGroup1," accessible via port 8484. Each service within the group has a unique endpoint, combining the group's basepath with the individual service's basepath. Note: This feature is currently behind a feature flag. Contact Support for access.


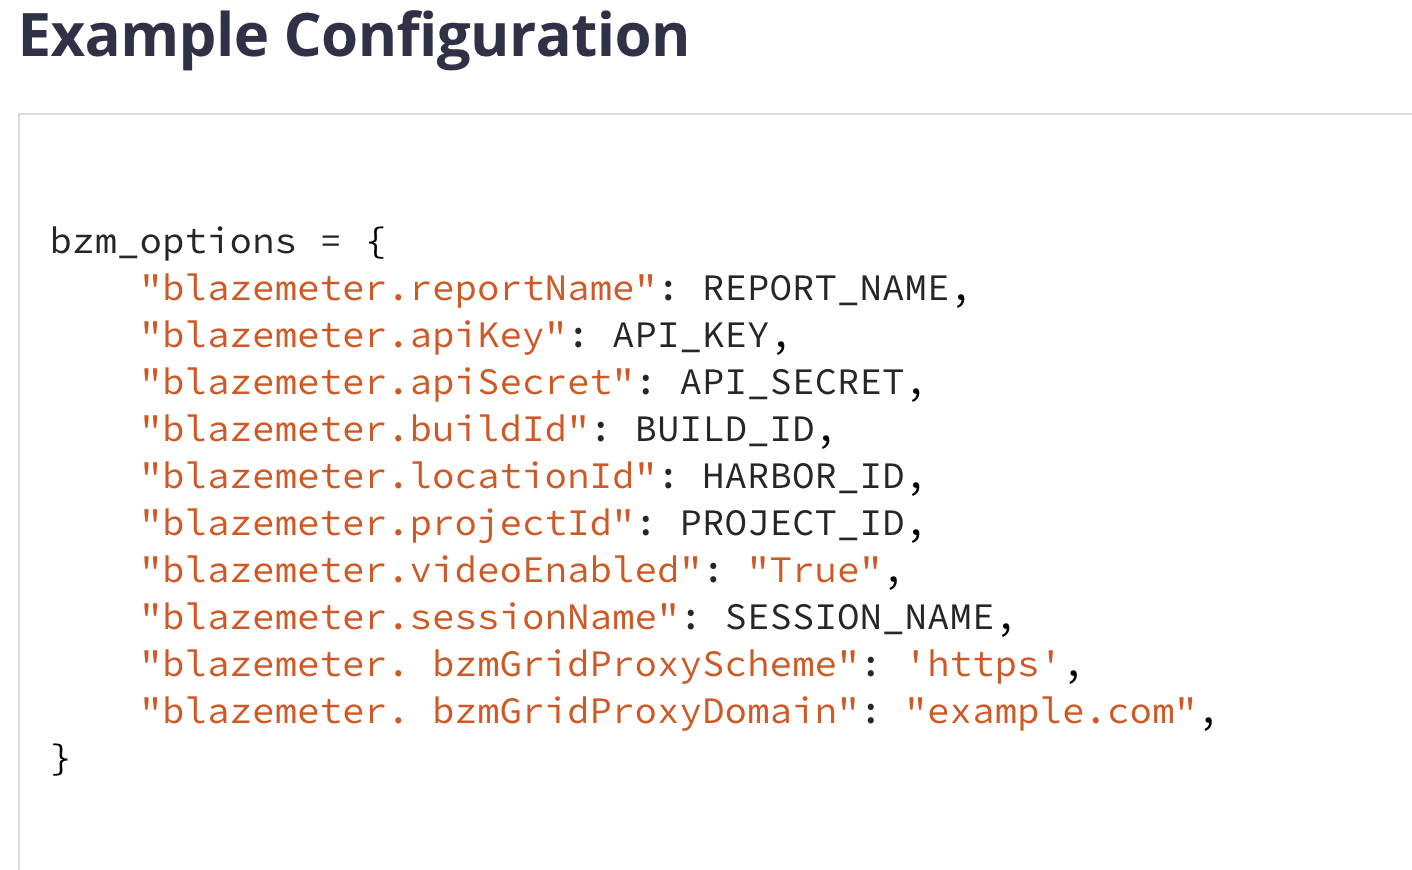
[Functional]: Grid Proxy Support for HTTPs
The Grid Proxy URL server now supports HTTPS, addressing security team requests to avoid HTTP exceptions. When using HTTPS, a domain name, custom secure certificate, and key are required.
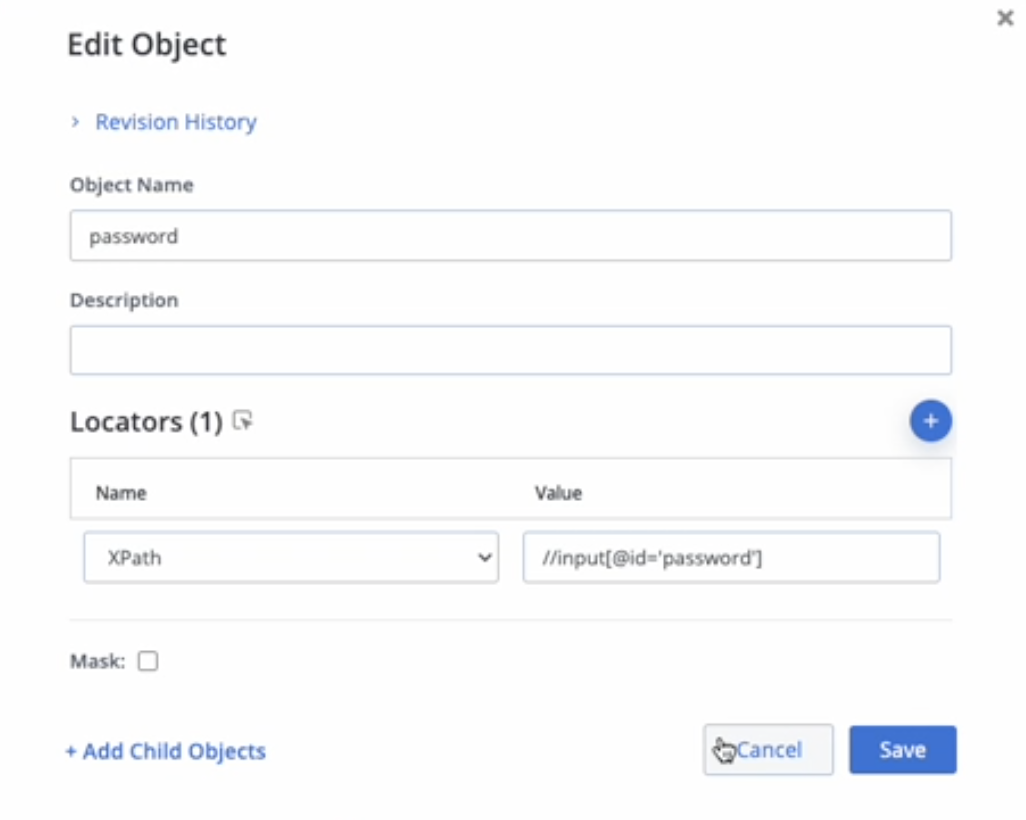
[Functional]: Mask Plain Text Password on Results Page & Editor Page
Passwords are now masked by default on the results page.
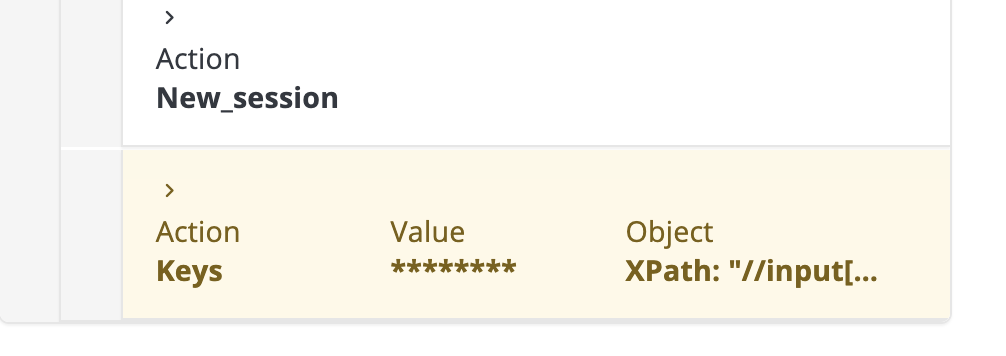
Additionally, the step-level editor page includes a new "Mask" checkbox, enhancing UI security by masking passwords according to best practices.
[Performance]: Displaying Error Response Body in Errors Tab
Root cause analysis takes a major leap forward with the error response body now displayed directly in the Errors tab!
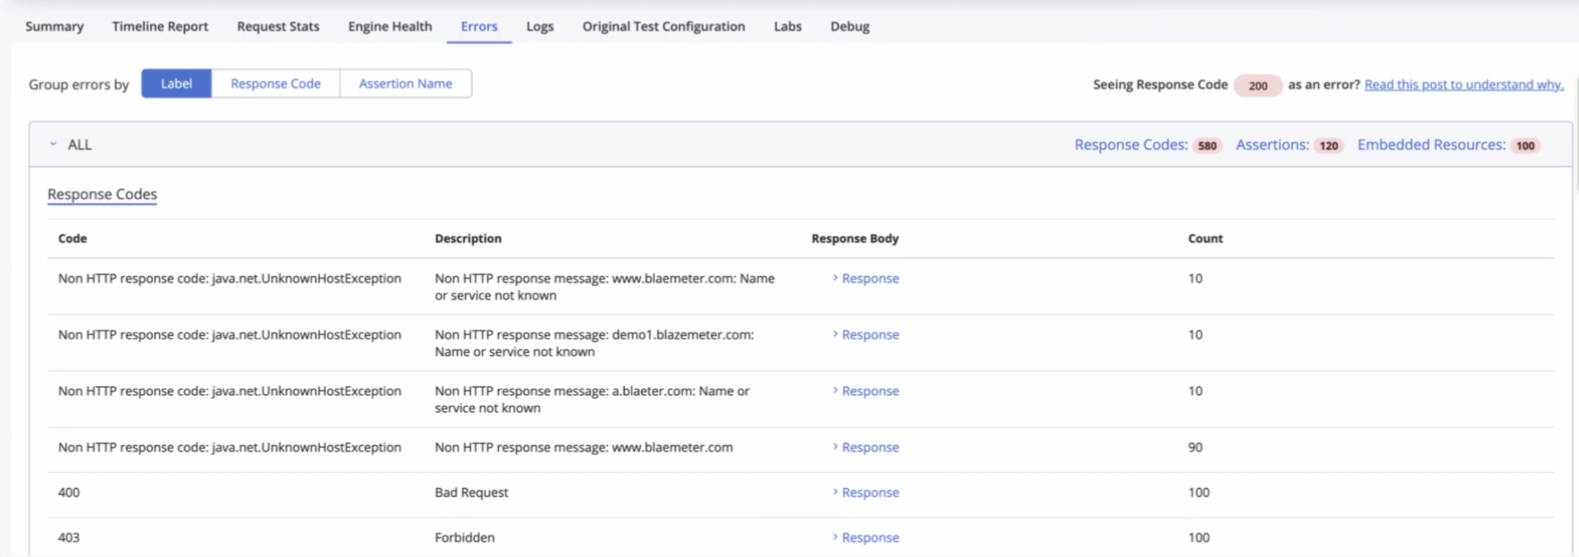
When you run a performance test, your API calls might sometimes return an error. These errors are displayed in the Errors tab in the report. Previously, users could only see the label (where the error occurred), the error code, and the error description. To further analyze and fix the issue, users needed to see the error response body, which was only accessible through the Logs tab. This required finding the relevant engine, downloading the artifacts.zip to a local machine, opening the error.jtl file, and searching for the error body—a tedious, time-consuming process.
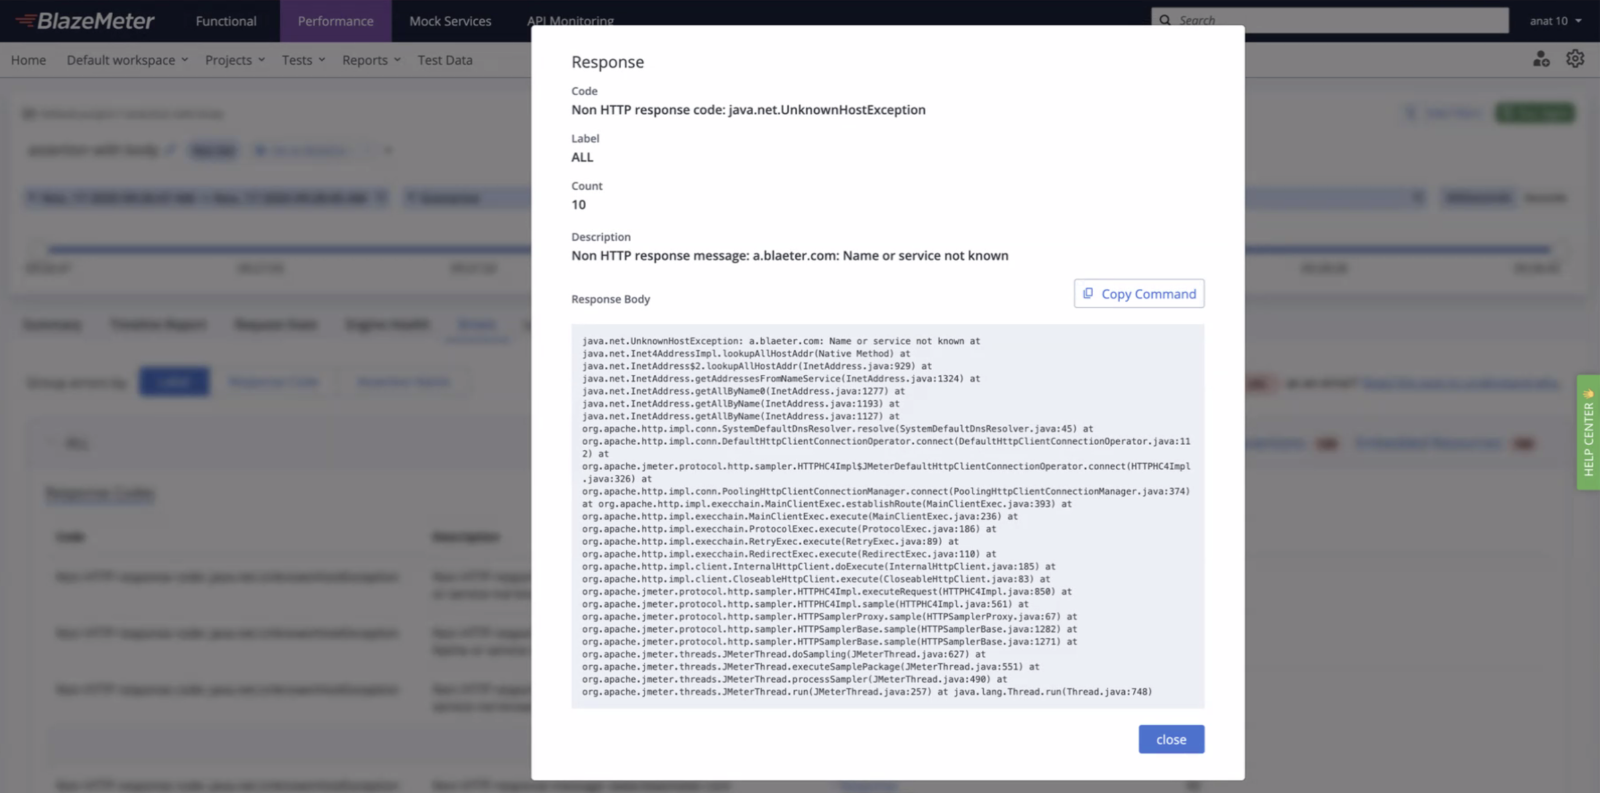
Now, users can see the error response body directly in the Errors tab. No need to switch tabs, search for the relevant engine, or download and manually search through artifacts. BlazeMeter saves and displays the error response bodies of the first 10 occurrences in the Errors tab under the relevant label, error code, and error description.
Note: If your security policy requires hiding the error response body in the Errors tab, you can disable this feature. Go to: Account → Environment → Display Response Body in Errors, and turn the toggle off.