Blog
February 18, 2020
JMeter Listeners - Part 1: Listeners with Basic Displays
Open Source Automation
What Are JMeter Listeners?
JMeter Listeners are the JMeter component that displays test results. But there is more to them than just that. The variety of JMeter listeners enables performance engineers to monitor the requests sent from JMeter as well as to analyze the responses received from the system under test.
Listeners aggregate time and capacity related information that JMeter collects from requests and responses, or deal with statistical information like distribution and percentage. Advanced testers can even use BeanShell or JSR223 listeners to customize the collection and to consolidate performance test metrics. Nearly all listeners have the ability to write results to a file, allowing performance engineers to transform them to the format they need for analysis.
This blog post series will go over the different types of Listeners. This time we will go over listeners that collect and display data from samples in a basic format, without conducting any complex calculations or manipulations. Part 2 is about listeners that aggregate data samples. But first, we’ll explain where to place Listeners in a test script.
Back to top
Placing JMeter Listeners in a Test Script
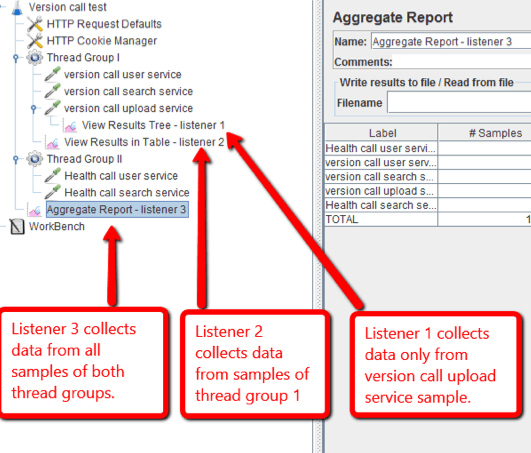
All Listeners can be found by clicking Add->Listeners. A JMeter Listener will only collect data from JMeter elements at or above its level. If a listener is added to the script as a child element, it will only show the data related to its parent. If a listener is added under a thread group of a script that has a few thread groups, that listener will display the data of all the samplers that belong to that thread group. If you need to review reports of all the samplers in a script, place the listener at the same level of all thread groups in the script.
This is illustrated in the screenshot below:
Back to topView Results Tree
The View Results Tree listener displays samples that the JMeter samplers generate, and the assertion results that are related to these samples. This listener displays the samples in the order they are generated by the JMeter script ,and provides parameters and data for each of them.
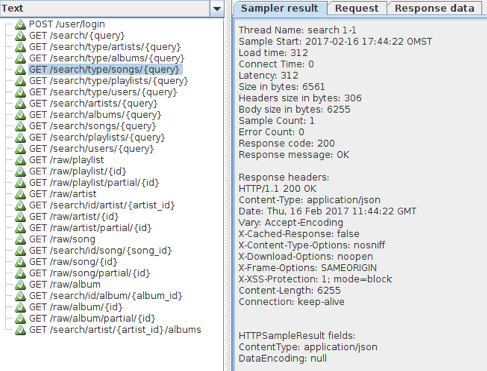
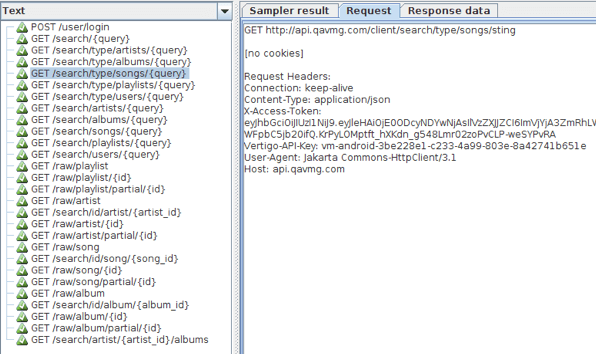
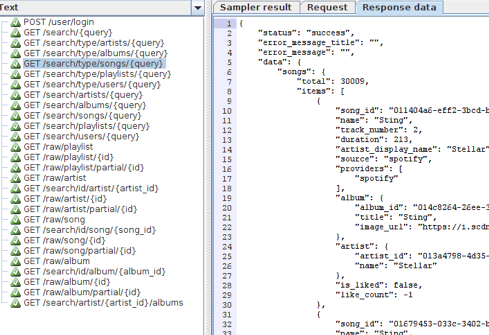
For instance, for each sample the HTTP sampler produces, the View Results Tree listener provides the request parameters, response parameters and the response data. This is displayed under the corresponding tabs: sampler result, request, and response data.
The Sampler result tab contains the response code, headers, cookies and information about time, latency, response size in bytes - separately for the headers, the body and the error count.
The Request tab contains information about headers that the JMeter script added, the URL, the HTTP method and cookie information.
The Response data tab contains the response body of the sample.
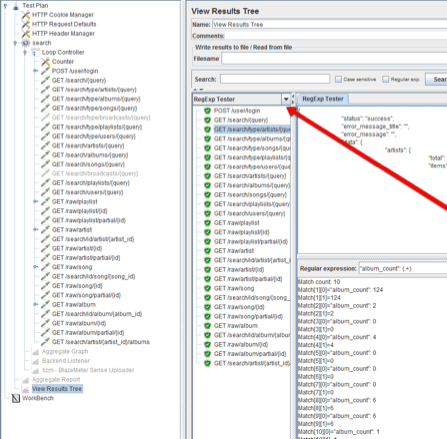
One of the most useful elements of the View Results Tree listener is a tab that renders information transmitted in the sample body into the required format: simple text, HTML, or XML. It also filters substrings, by using RegExp patterns, specific XPath, JSON Path or CSS. This helps constructing and validating the following corresponding PostProcessors in the script.
An example of using the RegExp tester in the View Results Tree listener is shown in the screenshot below.
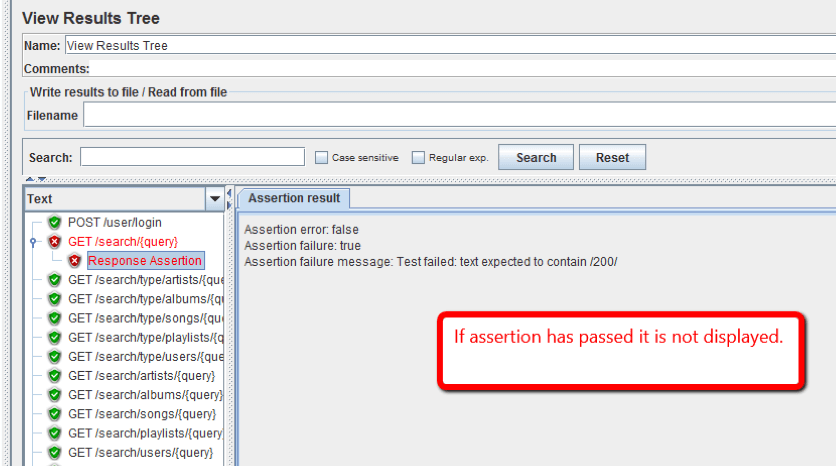
The View Results Tree listener also displays failed assertions, and compares expected and actual results. However, if the assertion passes the success is not displayed. An example is shown in the screenshot below.
Back to topView Results in Table
The View Result in Table listener displays information about each sample in the form of a table. The table shows time related data for each sample, the payload data, the thread number and the sample execution result. Results in the table are in the order the time samples were issued. This listener is useful for getting a quick estimation of the behaviour of the system under test.
Back to topSpline Visualizer
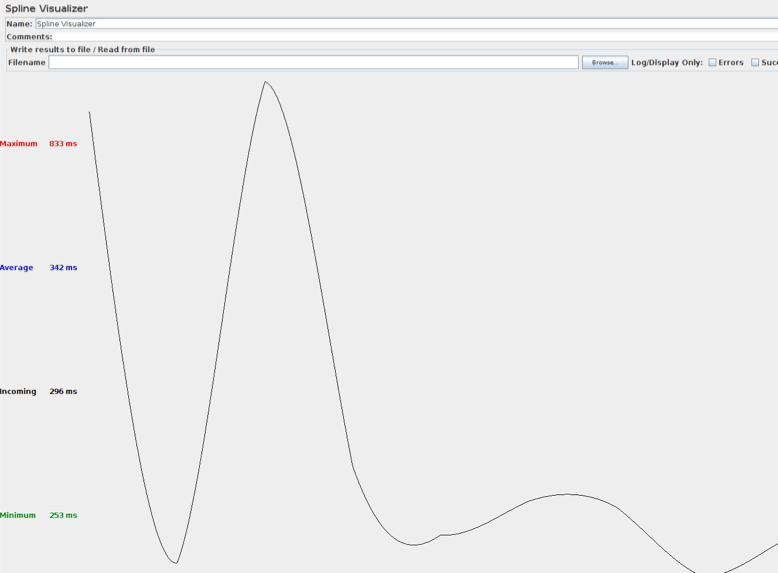
The Spline Visualizer (available in JMeter 2.13 but not in more advanced versions) displays the change of the response time over the course of the test, in the form of a graph. Ten points are used to build the graph, which means that samples are divided in ten groups, and their average response time is calculated. Then the spline interpolation is applied to smooth the graph.
If the Spline Visualizer listener is configured for all the script samples, it displays the responsiveness of the system over the course of the test. If this sampler is configured as a child element of a sampler, then this listener shows how the response time related to sampler changes over a part of the test, for example for the login time. The listener and the graph it produces are shown in the screenshot below.
Back to topResponse Time Graph
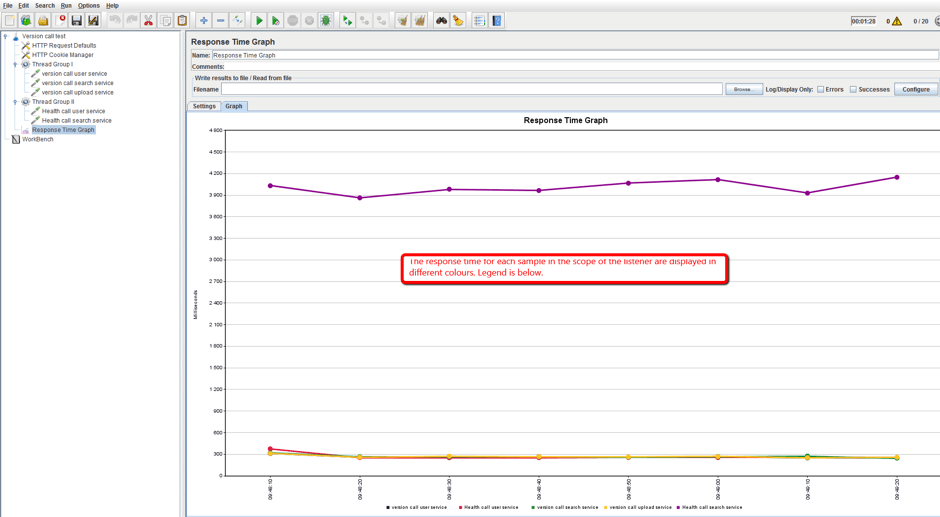
An additional listener that plots a graph of the samples’ response time over the course of the test is the Response Time Graph listener. This listener is able to plot a graph either for all samples or for selected ones. This is demonstrated in the screenshot below.
Back to topAssertion Results
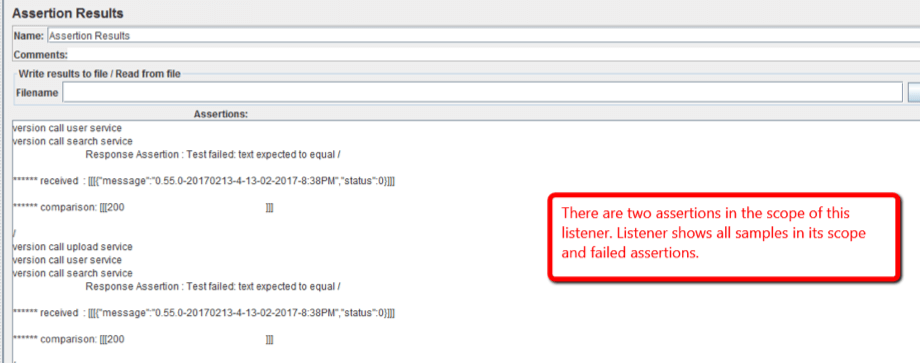
The Assertion Results listener displays results of all the assertions in its scope. This listener displays samples as they go and failed assertions for related samples, if there are any. Passed assertions are not shown. This listener is shown in the screenshot below:
But there is a problem with the listeners we’ve mentioned so far - they are resource-consuming elements. Therefore, sometimes it’s better write the data to a file during the test and then to process the saved data after the test finishes. This is especially true if the supposed volume of the displayed data is large.
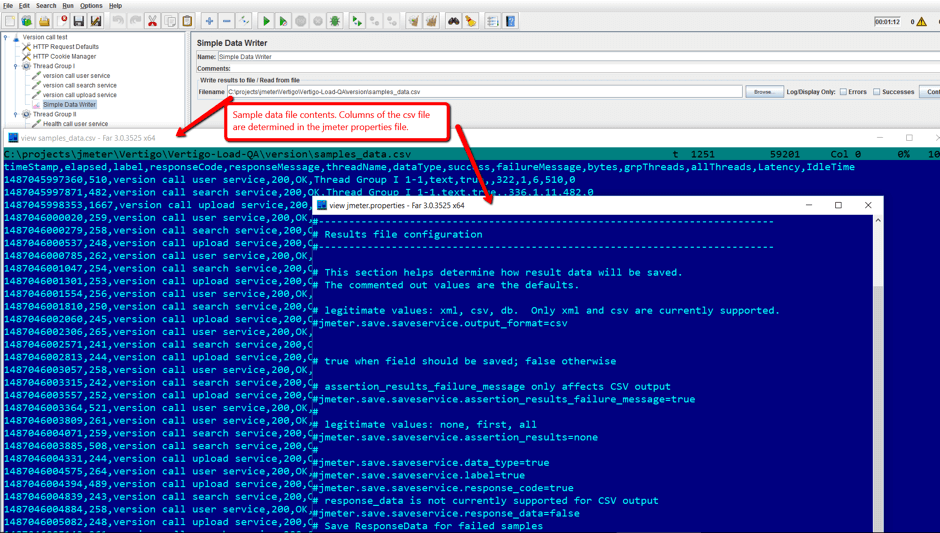
To do that, there are listeners that only write data to a file and to the JMeter log, without displaying them in tables and graphs. Data from samples can then be saved in two formats: CSV and XML. Format and saved data are defined in the JMeter properties file.
Back to topSimple Data Writer
The Simple Data Writer is such a listener. This listener can write results only to the filename that is provided. The contents of the file and its format are determined in the jmeter.properties file, which is located in JMeter’s ‘bin’ folder. In the screenshot below you can see the contents of the JMeter properties file and the saved data.
Back to topFlexible File Writer
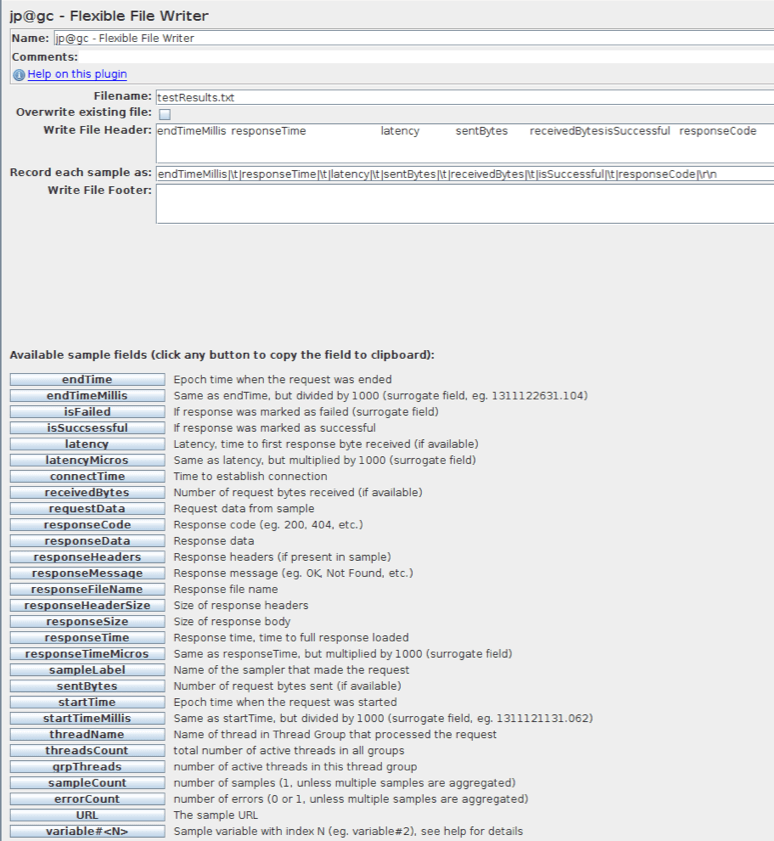
The Flexible File Writer listener is more advanced than the Simple Data Writer. It allows you to configure which sample data to print out to the file, while configuring the file header and footer. The listener is shown in the screenshot below:
Back to topSave Responses to a File
The Save Responses to a File listener saves the information about each particular response to a separate file, and then indexes it. The filename consists of the base part of the file name and an index. The developers who use this listener should take into account that a number of files might be created.
Please note that when running your tests in BlazeMeter, you should remove or disable the Listeners, unless you intend to generate extra log files. This is because they consume resources from the machine or engine that is running the test.
Congratulations! You now have comprehensive knowledge of the first group of JMeter listeners. Stay tuned for the next part.
If you want to learn more advanced JMeter, check out BlazeMeter University.

