Blog
June 14, 2018
When we think about serverless environments we usually assume that they solve our scaling problem. We no longer need to worry about scale, right? Wrong.
You might have a very complex application running serverless and not be aware of which elements in your system have the ability or inability to function in a large scale. Therefore, in this article, we will talk about the different aspects to notice when you’re building a serverless application, and what you should be taking into consideration for the app to naturally scale and not crash under traffic loads through serverless testing.
How to Do Serverless Testing
The plan for this article is simple:
- Create a small serverless application with a simple flow that runs on AWS
- Run it under a heavy load with Apache JMeter™ and also with BlazeMeter
- Wait for it to break
- Dig deep and understand what broke it
- Analyze results with Epsagon
Let’s Start — Building Our Test Candidate
I’ve created a simple serverless application that runs on AWS. It is a simple “voting” system with two endpoints; one to place a vote and the second to view the voting results. In the following examples we will focus on a single flow — placing the votes.
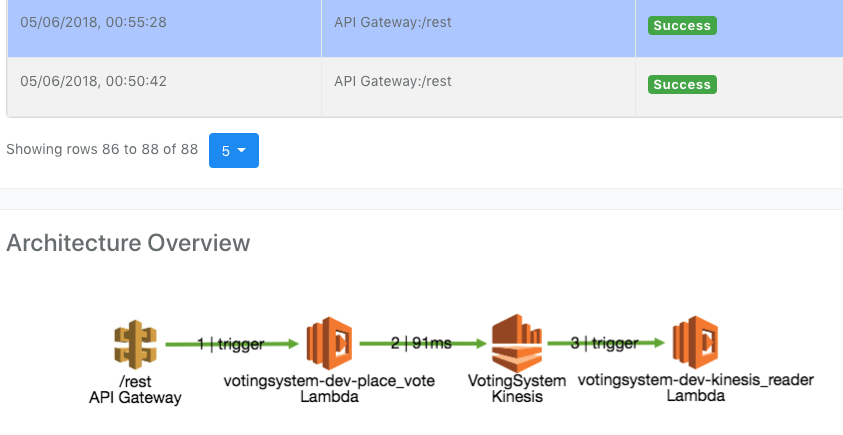
Example Voting System — Place Vote Flow
The entire system runs serverless using AWS Lambda and Kinesis as a data pipe with default configurations.
Every POST request received by the user (via API Gateway) invokes the PlaceVote Lambda. It then processes the user voting information and publishes it to the Kinesis Stream.
This is the PlaceVote code, which you can also find here on GitHub Gist:
from json import dumps
from uuid import uuid4
import boto3
from time import time
from os import environ

KINESIS_STREAM_VAR = 'KINESIS_STREAM_NAME'

client = boto3.client('kinesis')

def place_vote(event, context):
    """
    Reading vote information from user and publishing it to the kinesis stream
    :param event: event object
    :param context: event context
    :return: response object
    """
    data = event['pathParameters']
    record_data = {
        'time_id': time(),
        'vote_id': data['vote_id'],
        'token': data['token'],
        'vote_choice': data['vote_choice']
    }

    result = client.put_record(
        StreamName=environ(KINESIS_STREAM_VAR),
        Data=dumps(record_data),
        PartitionKey=str(uuid4())
    )

    response = {
        "statusCode": 200,
        "body": dumps(result)
    }

    return response
Now let’s run this app in a performance test.
Running the Performance Test
Running a Stress Test Using JMeter
Stress testing is a load testing technique that examines the performance of the upper limits of your system, by testing it under extreme loads. Stress testing examines load testing KPIs like response time and error rate, as well as memory leaks, slowness, security issues and data corruption. In this example, I will run a stress test on the app with JMeter.
About JMeter
JMeter is an open source application designed to load test functional behavior and measure performance. JMeter is also handy when we run serverless applications since we can load test every single node in our system separately, or test the main flows in our system combined.
Choosing the Performance Test Scenarios
When deciding which scenario to load test, it is important to pick the most common and vital use cases of our system, which are part of the main flow. The Voting System we have deployed as an example for this post has two primary use cases: placing a vote and reading the voting results. In the following example, we will try to break the first use case — placing a vote.
Creating the Performance Test Script
We start off with creating a simple JMeter script. There are a few tools online that help you create your JMeter script easily. My favorite is BlazeMeter’s chrome extension, which enables you to record your HTTPS traffic, and generates a JMeter script that you can configure and run.
For this example, I’ve created a small JMeter script, which you can find here on GitHub Gist, that contains a single POST request to our Voting System endpoint, with the vote information (such as vote_id and vote_choice). We can use JMeter to run it with multiple threads for any duration we would like. I ran it for 1,000 users, for 10 minutes. More about JMeter and how to use it here on Apache JMeter and here in this BlazeMeter blog.
Let’s run the load test and check the results.
Analyzing the Results — Finding the Hidden Errors
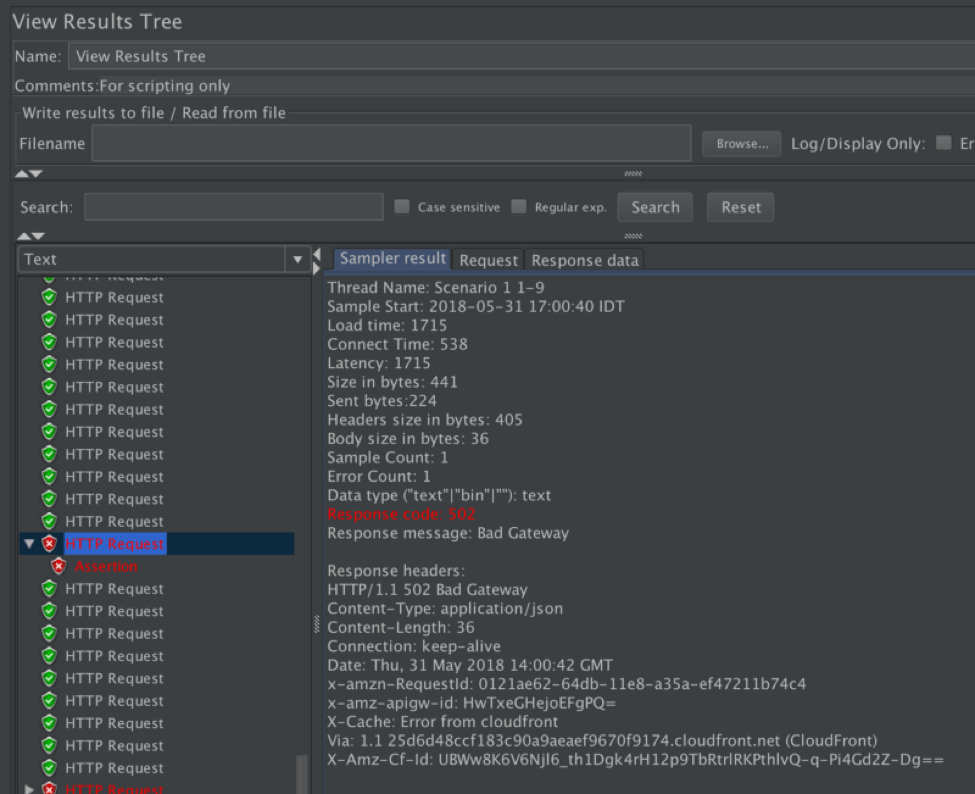
JMeter Results with 502 Response Code
Our results contain 96% of success responses (200) from our Voting System and 4% of failure, which are all 502 (Bad Gateway) responses from the AWS API Gateway.
What do we do from here? We need to dig deeper and understand the errors. A quick look at the AWS docs tells us that 502 Bad Gateway indicates that something went wrong in our backend code, meaning that our Place Voting Lambda did not end properly and threw an exception.
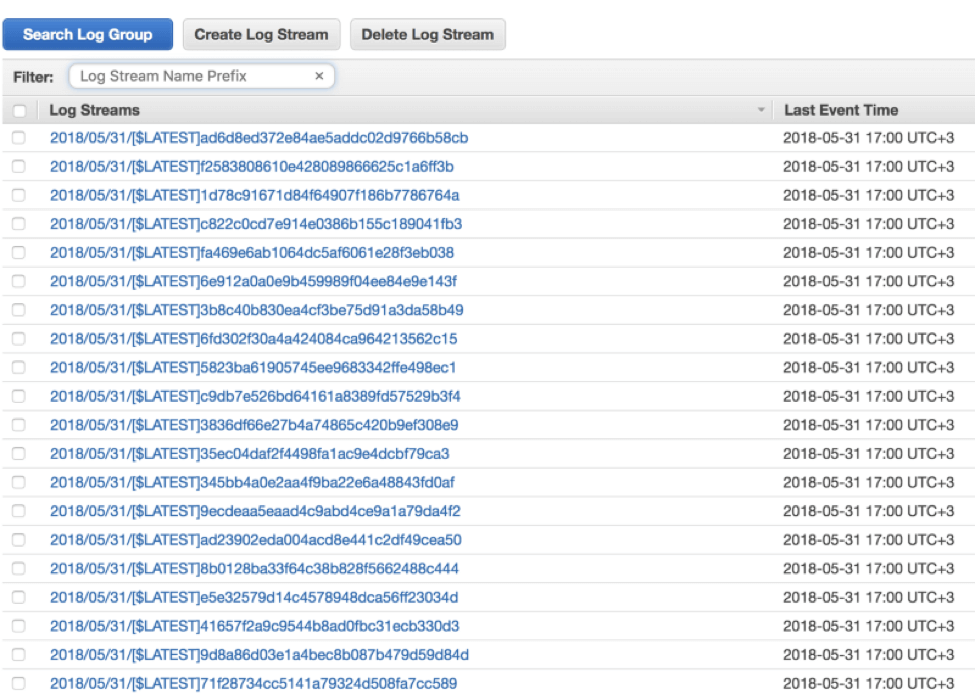
So, if our Lambda threw an exception, where can we see it? For every Lambda invocation, a new log stream that includes prints and exceptions is being generated in CloudWatch Logs. CloudWatch is built on 2 hierarchies — log groups and log streams, so looking for a specific line is seemingly impossible. Almost all of our invocations succeeded and we are left with finding the 4% that failed — and that’s like looking for a needle in a haystack.
like looking for a needle in a haystack, CloudWatch Logs
To handle this situation better, we can return an indicative response according to the error that our code handles. How? By wrapping our Lambda function for debugging purposes only with code that catches expected errors and rethrows unexpected ones. Also, it is recommended to add a more explicit log prints so you can search for specific keywords in the CloudWatch Logs and have a better understanding of the error.
So What Happened?
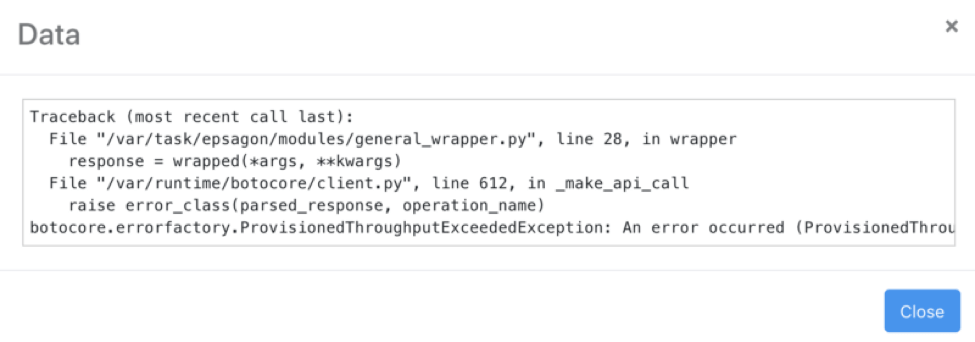
Once we find the error log we can see that an exception was indeed thrown:
Kinesis ProvisionedThroughputExceededException
Looking up this exception online we can learn that our request rate for the stream is too high, or the requested data is too large for the available throughput.
It seems that the Kinesis Stream can’t handle our request rate, We resolve this by checking our Streams Limits and set the Kinesis Stream with additional shards. There is a great post about Auto-scaling Kinesis streams with AWS Lambda by Yan Cui.
Next, we re-run our tests and repeat until all issues are solved.
Using an Observability Tool During Load Tests
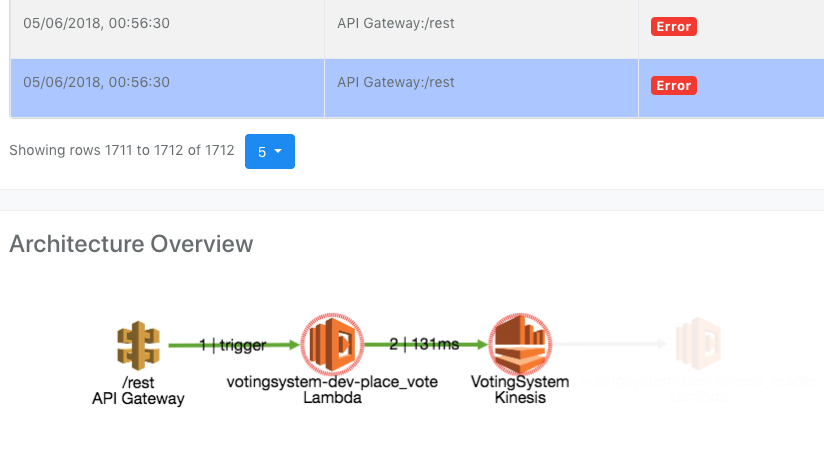
One thing that was absolutely clear was the inability to easily find out what really happened during the test. We had to go through an API Gateway and understand the possible reasons of the error and then we had to search CloudWatch logs for a hint of what went wrong in our Lambda.
At Epsagon, we try to tackle this issue by giving a broad picture of what is going on in serverless applications using distributed tracing and pinpointing the issues that caused it to break. Epsagon AI learns your application as it runs and understands how the different resources in your system are connected. It also alerts if a certain flow is broken or about to break.
Once the happy flow is broken for any reason, we get an alert and can easily access the problematic flow and view the errors and traceback.
Running Load Tests With BlazeMeter
BlazeMeter is useful for running load tests on a higher scale. It is practically JMeter in the cloud, with many other features such as test collaboration and scaling your test to run from multiple geo locations. It also brings out a graph of the responses and errors that occurred during the test in real time, as well as the ability to look at past test results.
BlazeMeter supports JMeter scripts, so we can throw in our test script, configure the load and geo locations and let it run.
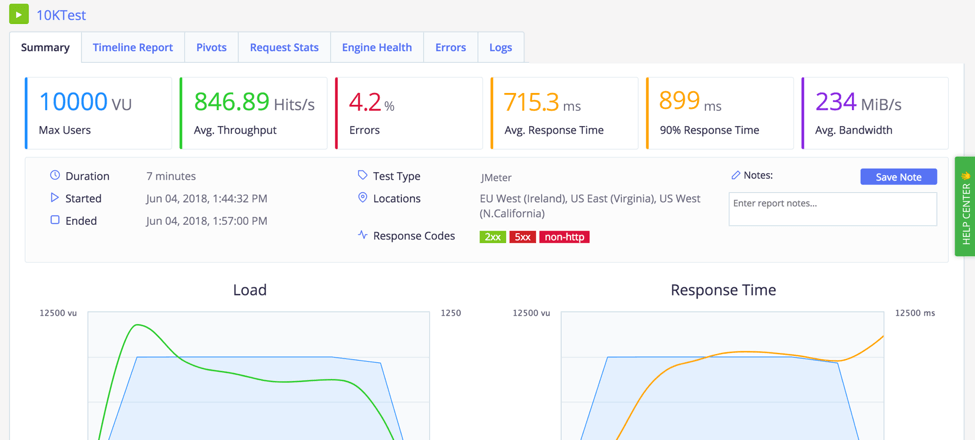
This time we ran the tests for 10,000 users. The response time was 715.3 ms with a 4.2% error rate. Like before, we understand and fix the errors, and run the tests again.
Conclusion
Running our serverless applications against a heavy load is very insightful. During such tests, we can encounter scaling issues, and eliminate them before they occur in production. We also discovered that cloud resources have their limits, and we have to take it into consideration while designing our system.
In addition, the approach of troubleshooting should be more holistic. Instead of inspecting each resource individually, a broad picture of the flow enables us to easily identify the problem and solve it quickly.
Stop wasting valuable coding time.


