Locust Monitoring with Grafana in Just 15 Minutes
The Locust performance framework provides handy monitoring of scripts in both GUI and non-GUI modes. But the out-of-the box GUI monitoring has a few drawbacks. First of all, its web UI reporting is not customizable. Of course, you can try to dive into the Locust source code and make your own custom Locust version. But in such a case, you break compatibility with the main version and it might bring difficulties as soon as you want to update Locust to a newer version afterwards. Also, it is worth mentioning that this approach is usually quite time-consuming unless you are a Python expert.
The Locust web interface provides you with a nice way to monitor results, but it doesn’t enable storing the web-presented metrics, for comparison with future results. Yes, you can take screenshots. Yes, you can create a pdf from the results page. But all of this requires a lot of additional effort and manual interactions, and gives you only static metrics, which you can not play with later
In this blog, we are going to show you one of the ways to monitor Locust scripts, save important metrics into a time-series database (to keep them stored for future comparison) and present all this useful data on outstanding real-time dashboards. Also, as you might notice in the article name, you can do this in just 15 minutes! Sounds intriguing? Let’s go then!
Back to top
Before We Start
In the past few years we are experiencing a strong displacement of the way we deal with the installation of additional tools and systems that help our development processes. Now, almost all these tools can be installed and configured in just a few minutes by using Docker and other virtualization/containerization technologies. If you need to setup a separate database or monitoring dashboard, it doesn’t make sense to spend many hours trying to install all prerequisites required for this additional tool, or investigating how you can apply additional configurations inside the tool.
Nowadays, you can easily find the Docker image that already gives you the container with the tool or even with a combination of different tools that you probably need to install for the integration. In this case, you don’t even need to spend any time to integrate one tool with another. We are also not going to waste time and we will just use an existing container that allows us to install the whole environment that can collect and show Locust performance metrics.
All you need to proceed with the steps mentioned below is to install the Docker application with the ‘docker compose’ extension. I’m pretty sure that you have already installed it, as it saves so much time and helps you to focus on the main tasks instead of spending time on tools installation and configuration. But if for some reason you still don’t have Docker installed on your machine, feel free to use this link and the proper section based on your current OS. As soon as you have Docker installed, you are good to go!
Back to top
Grafana and Graphite Installation
Grafana is one of the best dashboard applications for monitoring and analytics. It provides you with very robust dashboards that have hundreds of components for building very detailed monitoring. Also, it gives you an opportunity to perform different analytics on top of your data, drawing any combination of metrics and even some computing formulas based on your business goals. It is very often used as a company standard and maybe you don’t even need to proceed with installation steps if it is applicable to your company as well. However, do not worry if it is not. We will show you some tips explaining how you can spin up the Grafana dashboard on your laptop in just 5 minutes.
However, the main reason we want to use an additional monitoring tool is that we want to collect metrics and keep them as historical data. Metrics collected from performance testing tools are represented by time series data points. Each data point has a timestamp displaying when the metric came out, the metric name (e.g.response time or response length) and the metric value (e.g., 100 ms or 1MB). Obviously, we need a place to store this type of data. Fortunately, there are already many data storage tools to achieve this goal and such a storage type is called time series database.
There are many time series databases available in open source and each one has different advantages and drawbacks. We are not going to concentrate on the choice process between them because that is worth a separate article. We will stop our choosing process on the Graphite tool, because it is one of the most famous open-source tools that is usually used in combination with Grafana, and it provides a simple database storage to keep time-series data, called Carbon. Graphite is used by many worldwide companies so you don’t need to worry about long-term support and that it might become outdated anytime soon.
So now we came up with a combination of two different tools that can be used in integration, and together provide a handy way to store and draw our performance testing metrics. They also have the ability to perform additional analytics on top of this data. Now we are ready for the easiest part - installation.
As we discussed previously, there is no need to proceed with standard installation steps for both these tools when we can just find a prebuilt Dockerized solution that should work out of the box. If we spend a couple of minutes on Google you should find that there is a great Dockerized solution that utilizes both these tools and has a very straightforward installation that we can cover in just a few steps: https://github.com/kamon-io/docker-grafana-graphite
This project will allow you to run a combination of these tools in a few minutes:
- Grafana (monitoring dashboard and metrics analyses)
- Graphite (time series database)
- StatsD (lightweight statistics collector)
- Kamon (a set of tools for monitoring applications running on the JVM)
At this point, we are interested mostly in Grafana and Graphite and this integration has both. If you don’t find a need for the rest of tools, this Docker file can be easily edited to remove those. But we should not care about it right now as these additional tools do not take many resources and will run silently in parallel without impacting our main reporting workflow.
To implement Grafana monitoring, we need to implement reporting that will send metrics from a Locust script to a time series database that will be used as a source for Grafana dashboards. In our case, this time series database will be Carbon, which is a backend component of Graphite providing time series data storage. In this case our architecture will look like this:
As soon as you have all the prerequisites mentioned in the previous paragraph and Docker is installed on your local machine, the installation of these tools will take you just the two commands. First, let’s check out the repository with the dockerfile:
gitclonehttps://github.com/kamon-io/docker-grafana-graphite.git

After that all you need is to go inside the downloaded directory and run:
makeup
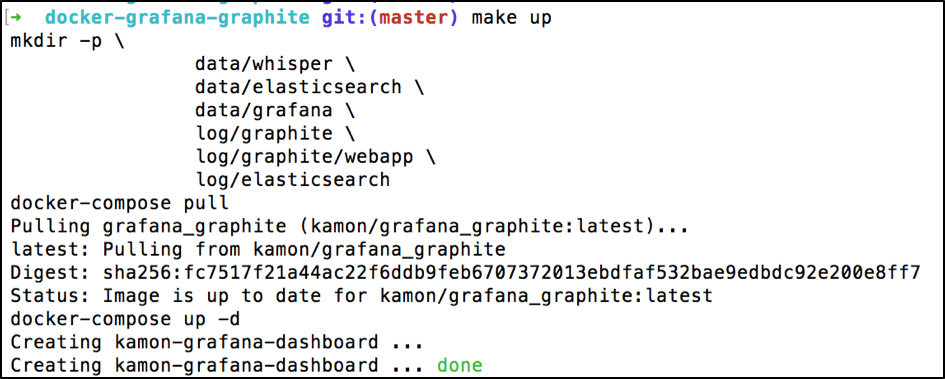
To verify that you can open Grafana use this link: https://localhost:80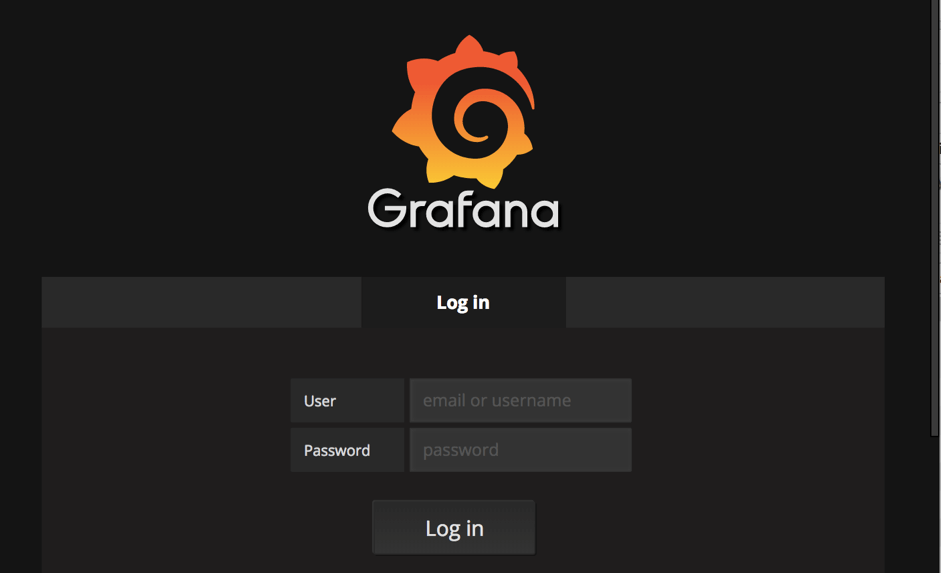
Check Graphite from this link: https://localhost:81
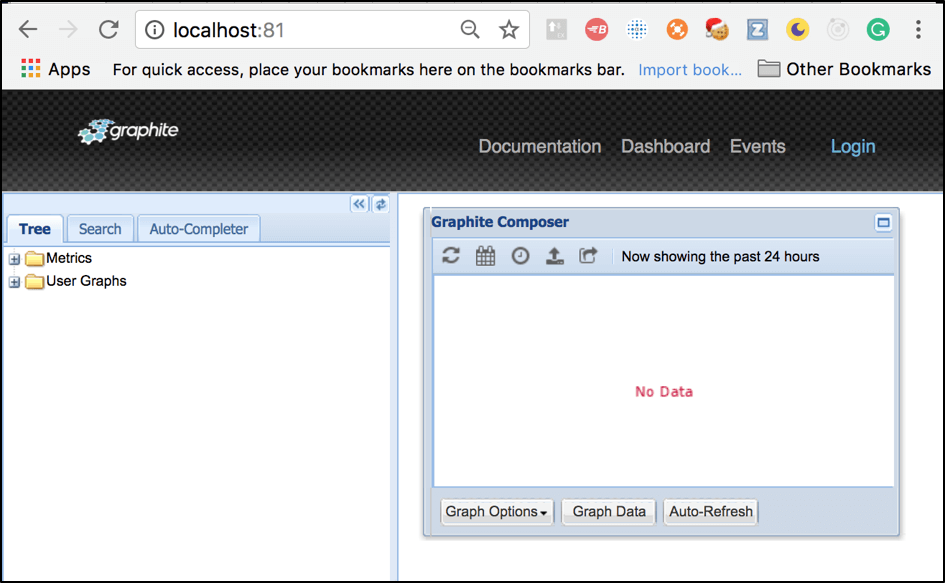
Surprisingly, that’s it. The installation has been completed and now you are running this batch of these tools on your local machine! With the help of Docker and the appropriate Dockerfile, we just setup the whole basic infrastructure that is required to start monitoring your Locust performance scripts in Grafana.
Back to top
Locust Metrics Reporting
First, to show you Grafana reporting in action we need to create a basic performance test by using the Locust framework. Let’s implement a script that triggers a couple of endpoints from the http://blazedemo.com web app:
SimpleLocustScript.py:
fromlocustimportHttpLocust,TaskSet,task,events,webclassFlightSearchTest(TaskSet):@taskdefopen_login_page(self):self.client.get("/login")@taskdeffind_flight_between_Paris_and_Buenos_Aires(self):self.client.post("/reserve.php",{'fromPort':'Paris','toPort':'Buenos+Aires'})@taskdefpurchase_flight_between_Paris_and_Buenos_Aires(self):self.client.post("/purchase.php",{'fromPort':'Paris','toPort':'Buenos+Aires','airline':'Virgin+America','flight':43,'price':472.56})classMyLocust(HttpLocust):task_set=FlightSearchTesthost="http://blazedemo.com"
Even if you do not have Python scripting experience, you can get an idea about the script steps. In this test we simulate user login, search flights between Paris and Buenos Aires cities and purchase of flight tickets. You can run this script by using this command:
locust-fSimpleLocustScript.py--no-web-c100-r1
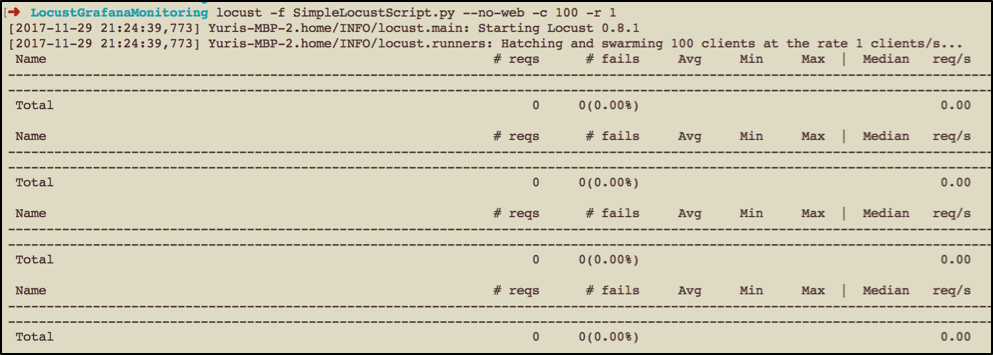
As soon as you see the same output, you are ready to move further and start metrics reporting implementation. If we go back to our diagram, this part of the workflow is here:
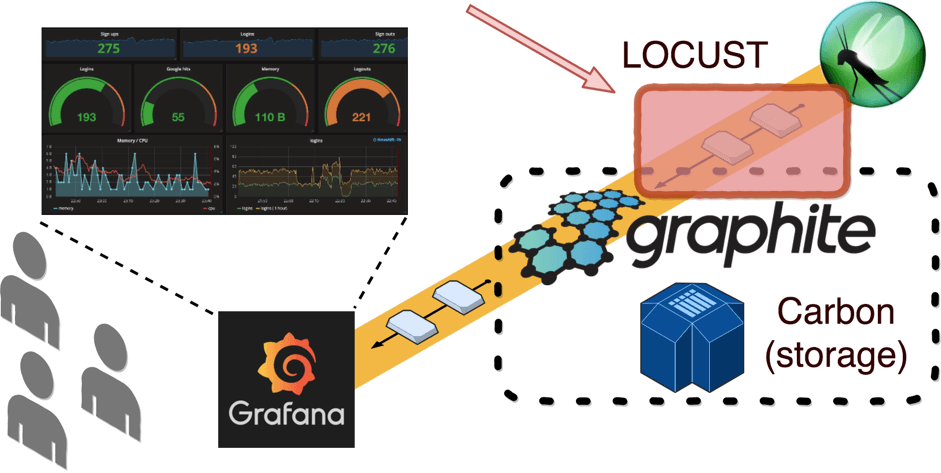
The most important data in our performance scripts is response time. Let’s verify how we can push response times metrics to Graphite. First, we need to find an appropriate Graphite API that can be used to accept data for storage. Fortunately, as any other time series database, Graphite provides flexible APIs for incoming data. There are several protocols supported by Grafite. We are going to use the most convenient and simplest plaintext protocol. This protocol allows you to send data inside Graphite (to the Graphite Carbon storage) just by using simple text in this format:
path> value> timestamp>
Carbon will automatically handle this plain text and convert it into a metric.
Now we know the type of data that we can transport from the Locust script to Carbon. But what about the communication layer? For communication and data transport you can use a simple socket that allows communication between two different processes on either the same or different machines from the same network. By default, Carbon provides the 2003 port that can be used for incoming socket connections. Now we know how and what we are going to send. So, the easiest part remains. Let’s implement metrics reporting from Locust by using a socket connection to Carbon.
First, we need to open a socket connection that will be used for metrics transportation. For better performance, it is highly recommended to open the socket once we start the test and close it at the end, instead of doing the same actions, again and again, each time we are sending the separate metric. This is because these operations take up resources that cost money, as well as execution time. In order to open the socket at the beginning of the test, you can use the __init__ function in this way:
classMyLocust(HttpLocust):task_set=FlightSearchTesthost="http://blazedemo.com"sock=Nonedef__init__(self):super(MyLocust,self).__init__()self.sock=socket.socket()self.sock.connect(("localhost",2003))
Second, we need to ensure that we close the socket after test execution. By default Python takes care of connections that aren’t closed if the application has been closed, but relying on that is bad practice. If you do not close sockets properly, the socket might get stuck thinking that the socket from our end is just slow. That’s why it is highly recommended to close sockets before the application is terminated (you can read more about Python sockets from this link). To close the socket properly even if our application crashed for some reason, we can use the Python exit handler that allows writing a function that will be executed before app termination:
classMyLocust(HttpLocust):……..def__init__(self):super(MyLocust,self).__init__()self.sock=socket.socket()self.sock.connect(("localhost",2003))atexit.register(self.exit_handler)defexit_handler(self):self.sock.shutdown(socket.SHUT_RDWR)self.sock.close()
After that, we need to decide at which point of the performance script execution we are going to send collected metrics. Obviously, to follow our monitoring in real time, we need to send metrics as fast as possible and ideally after each server response. Such behavior can be achieved by Locust event hooks. In software development, an event hook means a code that provides the ability to react to particular events happening in an application. As we want to send metrics for each request, we will be interested in these two event hooks, provided by Locust out of the box: request_success and request_failure hooks. We can use these event hooks this way:
classMyLocust(HttpLocust):…….def__init__(self):……locust.events.request_success+=self.hook_request_successlocust.events.request_failure+=self.hook_request_faildefhook_request_success(self,request_type,name,response_time,response_length):self.sock.send("%s %d %d\n"%("performance."+name.replace('.','-'),response_time,time.time()))defhook_request_fail(self,request_type,name,response_time,exception):self.request_fail_stats.append([name,request_type,response_time,exception])
Probably, it makes sense to explain the magic happening in this string (the rest seems to be clear):
self.sock.send("%s %d %d\n"%("performance."+name.replace('.','-'),response_time,time.time()))
As we are going to use a plaintext protocol to send metrics, we need to send all metrics (each metric should be send on separate line) in this format:
path> value> timestamp>
In this case, if we map our Python arguments in this pattern, we have:
- = "performance." + name.replace('.', '-')
- = response_time
- = time.time()
The last two values seem obvious but the first one requires an explanation. In order to group our metrics inside Graphite, we need to use a unique prefix. This prefix might be any string you want and we chose “performance.”. Dot symbols are reserved and used in Graphite (Carbon) to separate metric levels. That’s why we added name.replace('.', '-'), because our request name might contain some dots and we do not necessarily want to split request names into different levels. In this case, we just use another separator for that.
This is what the result script should look like:
fromlocustimportHttpLocust,TaskSet,task,events,webimportlocust.eventsimporttimeimportsocketimportatexitclassFlightSearchTest(TaskSet):@taskdefopen_login_page(self):self.client.get("/login")@taskdeffind_flight_between_Paris_and_Buenos_Aires(self):self.client.post("/reserve.php",{'fromPort':'Paris','toPort':'Buenos+Aires'})@taskdefpurchase_flight_between_Paris_and_Buenos_Aires(self):self.client.post("/purchase.php",{'fromPort':'Paris','toPort':'Buenos+Aires','airline':'Virgin+America','flight':43,'price':472.56})classMyLocust(HttpLocust):task_set=FlightSearchTesthost="http://blazedemo.com"sock=Nonedef__init__(self):super(MyLocust,self).__init__()self.sock=socket.socket()self.sock.connect(("localhost",2003))locust.events.request_success+=self.hook_request_successlocust.events.request_failure+=self.atexit.register(self.exit_handler)defhook_request_success(self,request_type,name,response_time,response_length):self.sock.send("%s %d %d\n"%("performance."+name.replace('.','-'),response_time,time.time()))defhook_request_fail(self,request_type,name,response_time,exception):self.request_fail_stats.append([name,request_type,response_time,exception])defexit_handler(self):self.sock.shutdown(socket.SHUT_RDWR)self.sock.close()
After that, you can run the script and verify data inside Graphite through this link http://localhost:81/:
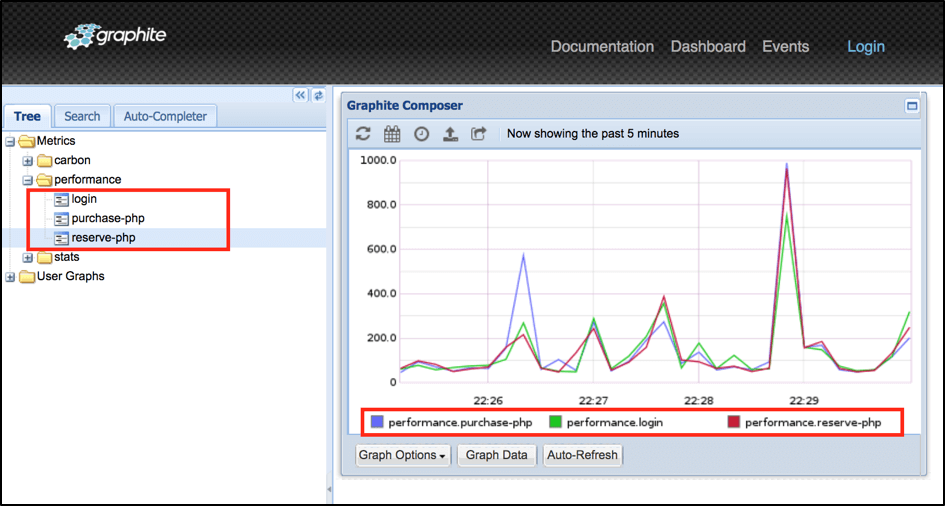
Now we know that our data is in place and we can implement some cool dashboards in Grafana!
Back to top
Grafana Dashboard Configuration
Grafana provides extremely powerful capabilities for dashboards creation. That’s why I recommend you go over examples from this link to get an idea how to create very detailed dashboards in Grafana using the Graphite query language. But in order to give you an incentive to do this, it is worth mentioning that Grafana has an outstanding capability to export and import existing dashboards so we already prepared a small example that you can use right away. All you need to do is:
1. Login to Grafana by this link http://localhost:80/ (use ‘admin’ for both username and password)
2. Click on the main menu button (top left corner)
3. Go inside the ‘Dashboards’ section
4. Click on the ‘Import’ button
5. Upload the json file downloaded from our examples repo from this link
As a result, you should automatically get the “Locust monitoring example” dashboard that already uses existing metrics from Graphite:
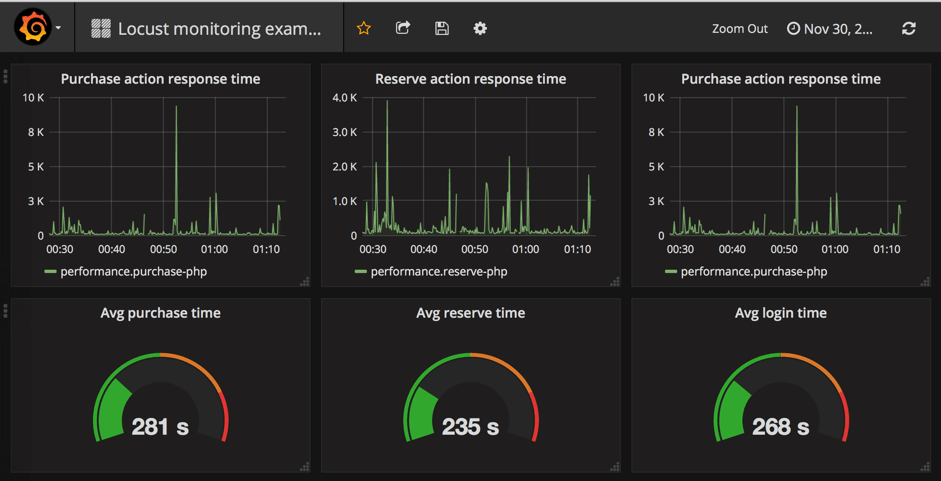
This a basic dashboard that contains information regarding response time for our tested endpoints. Using powerful Grafana capabilities you can add additional analytical elements to calculate average, minimum, maximum time and much more.
Back to top
Final Thoughts
In this blog we showed how you how we can implement Grafana monitoring for your Locust performance scripts in just 15 minutes. With Docker’s powerful capabilities of containerization services, you can setup the whole infrastructure for Grafana monitoring in few minutes. The rest is also simple as soon as you have some basic experience with Python. Of course, our solution is not full and there are many improvements that you can apply to make monitoring even better. For example:
- Implementing metrics reporting as a reusable component to use across different tests
- Adding additional metrics in addition to response time
- Implementing alerts in Grafana to get notifications in case your metrics cross a threshold
- Adding additional analytics to get other useful metrics like 90% response time
I hope that we gave you the main idea which you can use to monitor your Locust scripts in Grafana. Let us know which tools you prefer to monitor your performance scripts because detailed and comprehensive monitoring makes the job of performance test engineers awesome!
Related Resources
- Docker + Grafana + InfluxDB: How to Create a Lightweight Monitoring Solution
- JMeter + Grafana: How to Use Grafana to Monitor JMeter
Back to top

