Blog
October 7, 2019
Want to get started with the JMeter Transaction Controller? You're in the right spot.
What is JMeter’s Transaction Controller?
The JMeter Transaction Controller can be a very handy tool for organizing different segments of your test and determining how those segments will appear in a report. As stated in Apache JMeter’s documentation: “The Transaction Controller generates an additional sample which measures the overall time taken to perform the nested test elements.”
But what does that mean, and what are the implications of this “additional sample” on your BlazeMeter report?
If you’re not already intimately familiar with the functionality, it can be a bit confusing simply due to it being a bit of an abstract concept. Not need to fear! To demystify the topic, we will walk through this feature to see exactly how it behaves in different scenarios via various examples demonstrating the results.
Everything discussed here is going to center around this little checkbox for “generate parent sample”:
Back to top
How the JMeter Transaction Controller Works
To demonstrate how a Transaction Controller and its parent sample can work, let’s first create a very basic JMeter script. Feel free to do so yourself so you can follow you along. All we need this script to include for this experiment are:
- A single Thread Group
- A single Transaction Controller
- Two HTTP Request samplers
- A View Results Tree listener
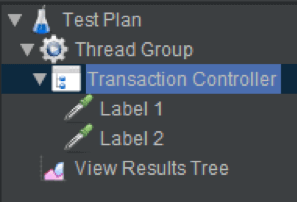
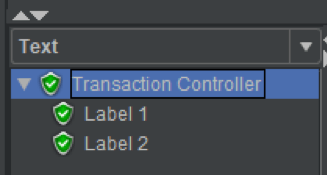
Place your two HTTP Request samplers within the Transaction Controller, giving each one a unique name (mine are “Label 1” and “Label 2”), like so:
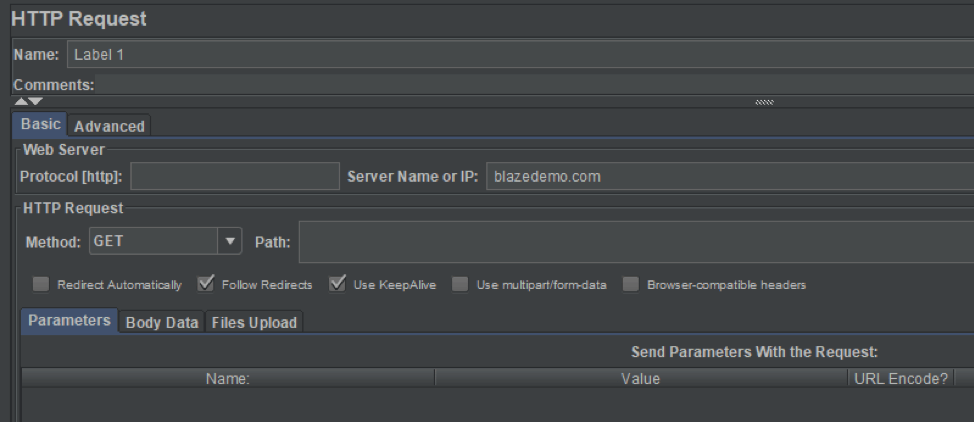
Next, configure each sampler to simply hit blazedemo.com:
The Transaction Controller is going to give us the execution time for everything inside it (our two samplers), combined as one single “transaction”.
Let’s see how we can tweak this Transaction Controller to get what we want from a test report.
Scenario 1: No Parent Sample
For our first experiment, we will setup our Transaction Controller so that no parent sample is generated by ensuring the “Generate parent sample” box is unchecked (disabled):
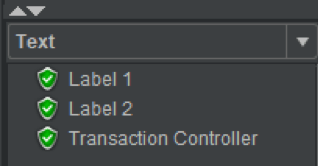
Save the test plan, then watch your View Results Tree listener as you execute the test. Note how our two samplers are displayed:
We see our two samplers, but there are three labels. That third label is our “parent sample”, the Transaction Controller itself.
The inevitable next question is, of course: Didn’t we disable generating a parent sample? We did indeed, so the parent sample appears as an additional normal sampler instead of as a an actual parent. Don’t worry -- This will make more sense when you see the second scenario!
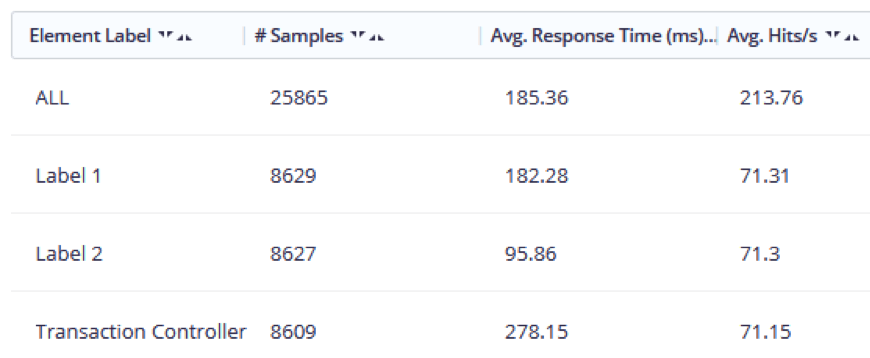
Next, let’s run this test in BlazeMeter, then review the Requests Statistics Report to see how labels are presented:
Just as with the View Results Tree, we have three labels, the third representing the Transaction Controller itself.
What does this mean?
Let’s go back to the JMeter documentation’s description: “The Transaction Controller generates an additional sample which measures the overall time taken to perform the nested test elements.”
In other words, the test generated metrics (avg. response, avg. hits/s, etc.) for both:
- The individual contents of the Transaction Controller (“Label 1” and “Label 2”).
- The combination of the two labels; in other words, the complete “transaction” from beginning to end, displayed as a third item.
This can be handy because it tells us both the metrics for everything inside the transaction controller, wrapped up as if it were all one sampler, and the metrics for each of said contents individually.
Conclusion: If we do not enable parent samples, metrics will be reported for both the transaction as a whole and for the transaction’s contents (children).
Scenario 2: Generate Parent Sample
So what changes if we check the box?
The script remains otherwise unchanged; we’re only checking the box and nothing more. Save the test plan again, run the test, and watch the View Results Tree listener:
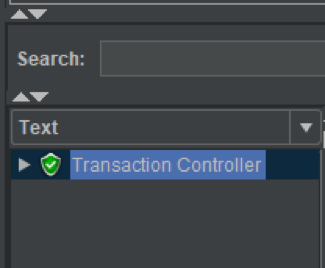
See how it’s changed? We now only see one label, which we can click to expand like so:
Enabling the “Generate parent sample” option now only gives us one label instead of three, which itself has two child labels -- our two samplers.
The parent sampler is now displaying as a parent that contains child samplers within it instead of as a normal sampler by itself. So if we “generate a parent sample” by checking the box, that means the parent sample will appear in reports as a parent sampler instead of as a third separate item.
Think of the checkbox as meaning “treat the parent as an actual parent in the report”. Now let’s look at how the Request Statistics Report has changed:
One label — that’s it!
Generating a parent sample means that, for reporting purposes, JMeter will only report metrics for the combined transaction; it will not report details about the contents.
Conclusion: Generating a parent sample will ensure that metrics are only reported for the combined contents of the Transaction Controller, not for the individual contents within it.
Back to top
Pros and Cons: Creating a Parent Sample For JMeter's Transaction Controller
Whether you want to generate a parent sample or not depends on what you want included or excluded for a report. Keep these points in mind when thinking about it:
- Generating a parent sample can help declutter reports if your script has many Transaction Controllers each with many samplers within.
- Generating a parent sample can make troubleshooting/debugging unnecessarily difficult. Consider that, in a test report, if one sampler fails, the entire Transaction Controller will fail, since everything is reported as one single label. The report will not indicate which specific item failed. Disabling parent samples can thus help with identifying the point of failure.
- A test report will regard the contents of a Transaction Controller as “embedded resources” if generating a parent sampler. (This isn’t just true of BlazeMeter, but JMeter itself.) This can understandably be misleading. For example, if your test encounters errors, you may find that the errors show for embedded resources when they in fact occurred due to a sampler inside the Transaction Controller failing. This again impedes troubleshooting, so disable generating a parent sample when reviewing any such errors.
- Not generating a parent sample can skew the reporting of certain metrics. This merits a discussion of its own, so read on!
Impact on Hits per Second
Something to be mindful of when using Transaction Controllers is the impact parent samples can have on measuring hits per second (hits/s), which is the metric BlazeMeter measures speed in, similar to how others may refer to transactions per second.
To demonstrate, let’s take the sample script we created earlier and run it through BlazeMeter. First, we’ll leave “Generate parent sample” unchecked (disabled). Note the hits/s result:
Next, let’s run the same script again, but this time with “Generate parent sample” checked (enabled):
That’s a nontrivial difference, isn’t it? This is due to how JMeter treats parent samples. Remember that if we don’t generate a parent sample, metrics (including hits/s) will be reported for both the Transaction Controller and its individual contents:
This skews the overall hits/s calculation since it’s essentially counting both the combined items and individual items, throwing off any calculation of averages.
This means that the test in which a parent sample was generated (the second example above), the hits/s measurement was more accurate. This is because with the parent sample accounted for everything within it without additionally counting itself as a separate item, thus no “extra” data is generated:
You can see how this setting can be a bit dangerous! It’s important to note that while generating a parent sample can be very useful for debugging purposes, actually generating a parent sample once you’ve confirmed everything is working is the way to go in order to ensure correct metrics in your Summary Report.
We understand if the concept here has twisted your brain a little after reading this!
The best way to really wrap your mind around the full impact of our “Generate parent sample” checkbox is to perform the above tests yourself, and try your own variations to experiment further. The more you practice with it, the more sense it will make.


