Blog
August 6, 2020
How to Monitor Your Server Health & Performance During a JMeter Load Test
Open Source Automation,
Performance Testing
Load testing isn’t just about test development and execution. It's also crucial to analyze the test results and pinpoint the underlying issues. In this blog, we'll cover JMeter performance metrics and how to monitor your server health and performance during your JMeter load tests.
Table of Contents
Back to top
What are performance testing metrics?
Let’s say you ran your test, got your results, and now you can see that the average response time is higher than it should be. The big question is “Why?” High response times tend to be caused by one of three reasons: Network Issues, Application Under Test, or Server Health Issues.
Today, I’m going to focus on Server Health Issues. I’ll be covering what to do when the server is overloaded with resources (such as insufficient CPU capacity, not enough free RAM, or a high Disk IO).
Back to top
How to Collect & View Server Health Metrics
JMeter Plugins has a plugin called PerfMon - which offers a great way to collect metrics on your server health. (Note: be careful not to confuse this with the Windows Performance Monitor - which is also called PerfMon!)
PerfMon consists of two parts:
Install the Server Agent under the test side on the application. This will collect health metrics and sends them via the TCP or UDP protocol back to JMeter. You can then view these metrics through the Metrics Collector Listener.
For this to work properly, check you have the following:
- The Server Agent running on the remote server.
- TCP or UDP connectivity between the JMeter host and the remote server on the default port 4444 (or any other free port).
- The Metrics Collector Listener enabled and added to the JMeter Test Plan.
Back to top
How to Install PerfMon
Here is how to install the Server Agent and Metrics Collector Listener:
The PerfMon Server Agent
The PerfMon Server Agent needs to be downloaded separately. Look for ServerAgent-x.x.x.zip on the JMeter Plugins download page.
The Server Agent is a Java command-line application, so you’ll need the Java Runtime Environment (JRE). I recommend using the same 64-bit Server JRE or JDK (Java SE Development Kit) of the latest available Java version for JMeter. You can download the JRE / JDK from Oracle’s Java download page.
When you unpack the downloaded Server Agent, you’ll see the following structure:
File | Description |
lib | Folder containing dependency libraries (mostly SIGAR) |
CMDRunner.jar | The same .jar file which comes with JMeter Plugins (this lives under /lib/ext folder of JMeter installation). This launches the Server Agent |
LICENSE | The Apache License file |
ServerAgent.jar | Main Server Agent library |
startAgent.bat | Server Agent Launch script for Windows |
startAgent.sh | Server Agent Launch script for Linux/MacOSX/Unix |
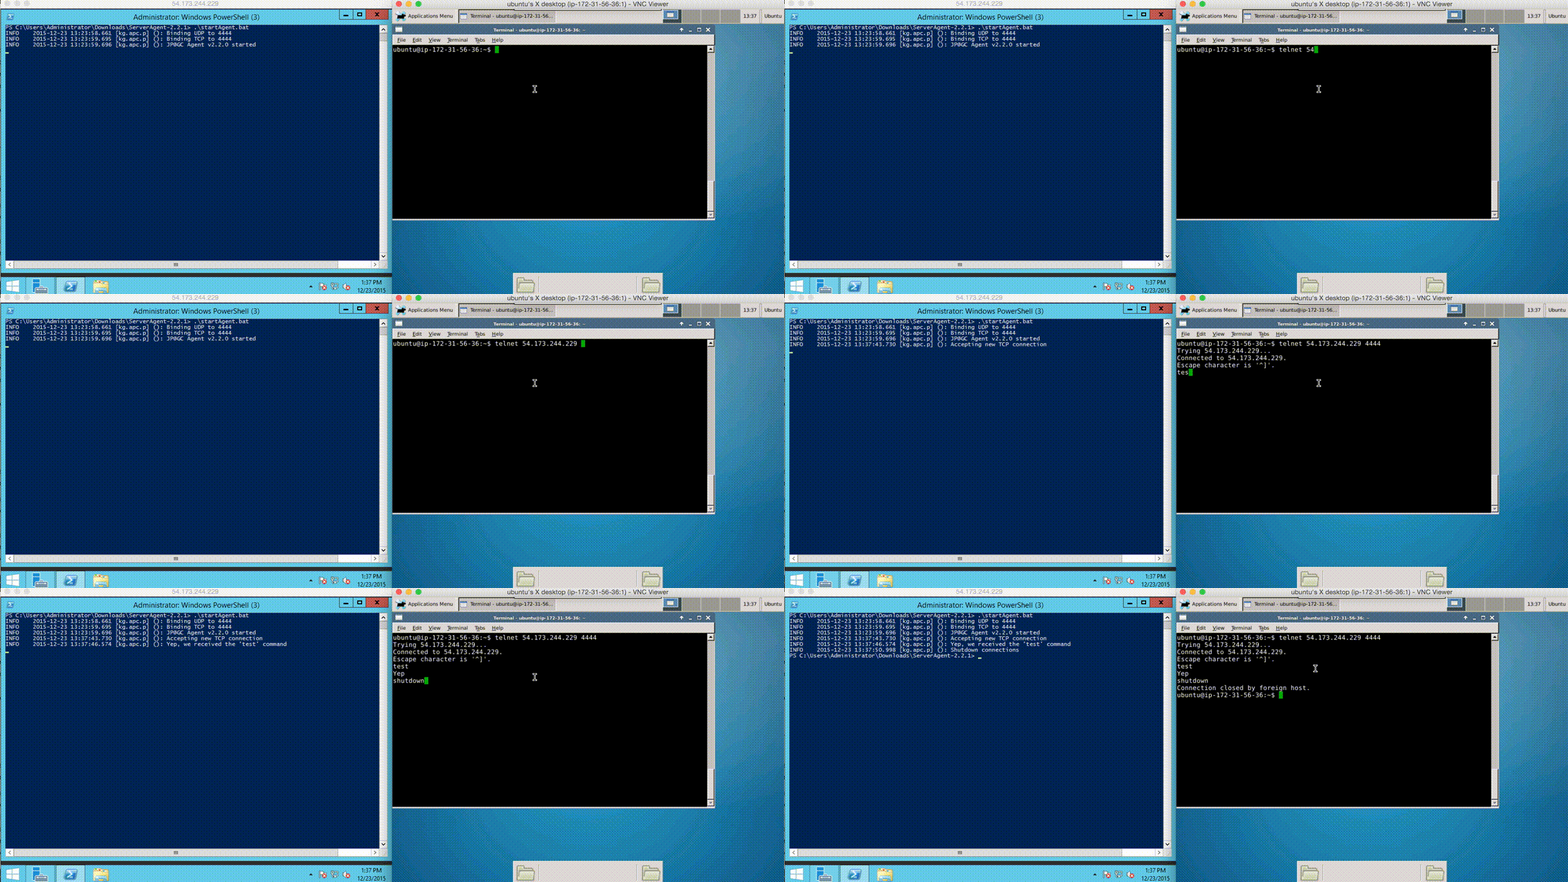
When you start the ServerAgent via the startAgent.x script, you should see three lines (like in the screenshot below):
This indicates that that the Server Agent is up and running, and listening for TCP and UDP connections on port 4444 (the default port).
It’s worth checking connectivity from the JMeter host before you run any load tests because you won’t see any metrics in the Results Collector if JMeter can’t connect to the Server Agent. The easiest way to check this is by sending a “test” message via something like telnet or netcat.
Here’s an example of a PerfMon Server Agent test running on Windows from a remote Linux system. You should be able to view three steps:
- The connection to the Server Agent
- The “test” command being sent
- The “shutdown” command being sent
If you can see a similar output, then you are all set up! If not, you will need to troubleshoot networking issues. The most likely problem here is that the port 4444 is blocked by a firewall on the application under test side.
Back to top
Installing the PerfMon Metrics Collector
The PerfMon Metrics Collector can be installed using JMeter Plugins Manager, look for the "PerfMon (Servers Performance Monitoring)" plugin
Back to top
How to View System Health With PerfMon
Now that you are all set up, here’s how you can view your system health:
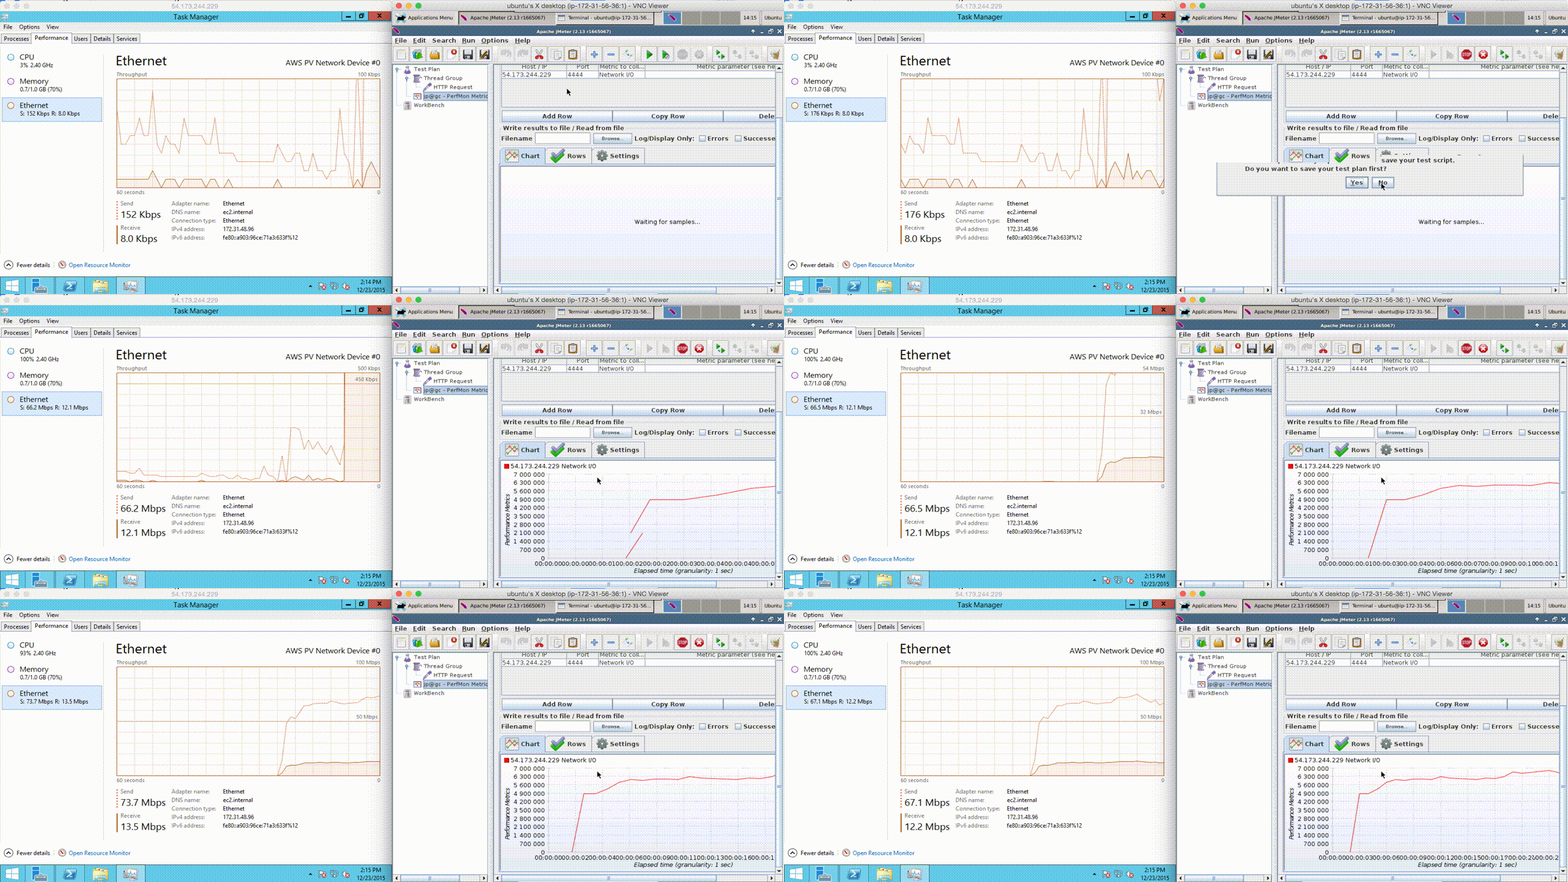
- Go to the Application under Test side (Windows). Open the “Performance” tab of the Task Manager and switch to “Ethernet” view.
- In JMeter, add the PerfMon Metrics Collector Listener and provide the IP address of the machine that the test application is on, the port the PerfMon Server Agent is listening to, and the “interesting” metric (in this case: Network I/O).
- Start the test and look at the charts on the left and the right.
As you can see, network utilization suddenly ramps up from almost zero to 70 Mb/s - and the Results Collector accurately reflects this. In this way, you can monitor more than 75 PerfMon metrics, including: CPU, Memory, Disk I/O, Network I/O, and JMX.
For this demo, I started the load test from the JMeter GUI. I do not recommend doing this for the actual load tests. The JMeter GUI should only be used for the development and debugging of tests. When it comes to test execution, I highly recommend sticking to the non-GUI mode.
Back to top
How to Monitor More Custom Metrics
Sometimes you need to monitor customized metrics which aren’t included in the SIGAR (System Information Gatherer And Reporter) API. In such cases, you have two more options:
TAIL
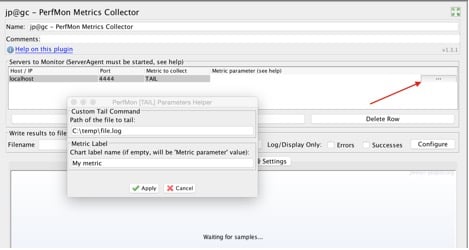
The TAIL metric offers the same basic functionality as the Unix tail command - it reads the last line of the given file and plots the results in the chart.
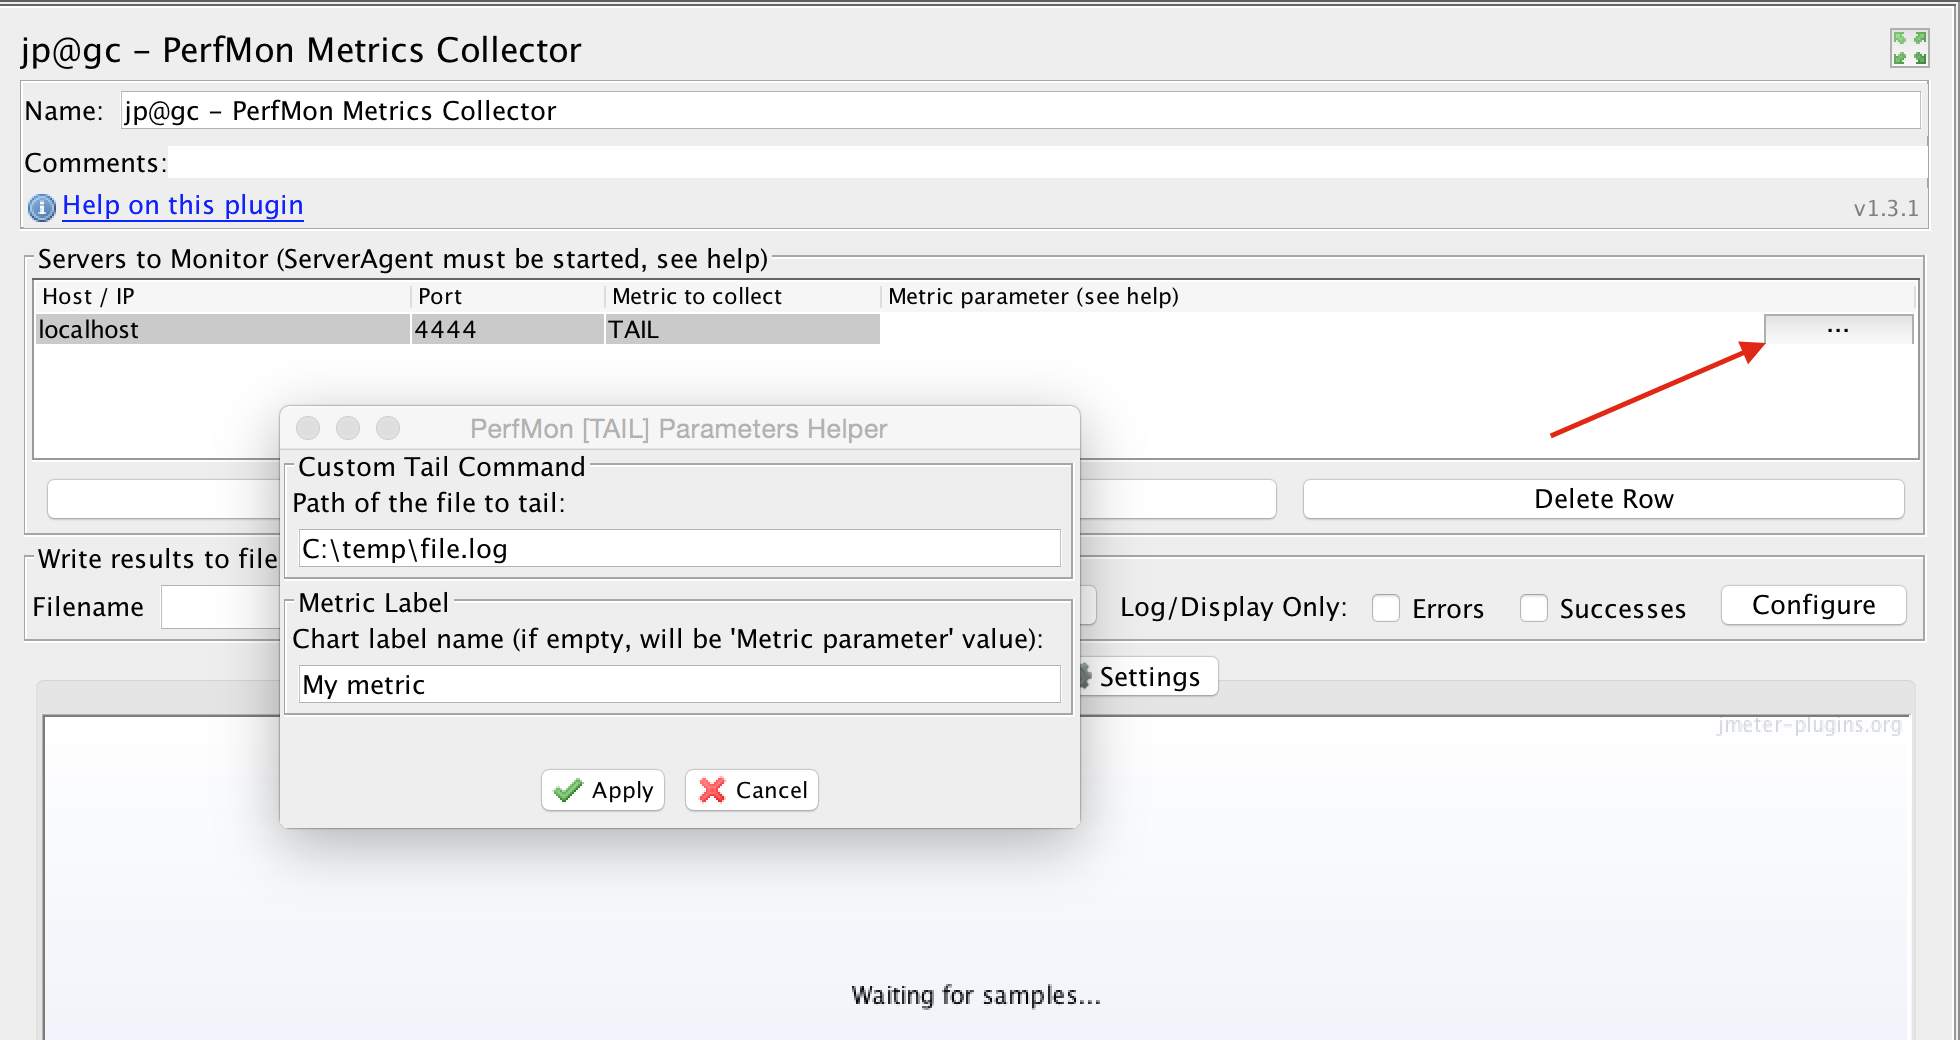
The file will need to be a single column set of plain numeric values, each on its own line. The filename and chart label are the only configurable parameters, you can set them clicking the three dots on the right hand side of the TAIL metric line:
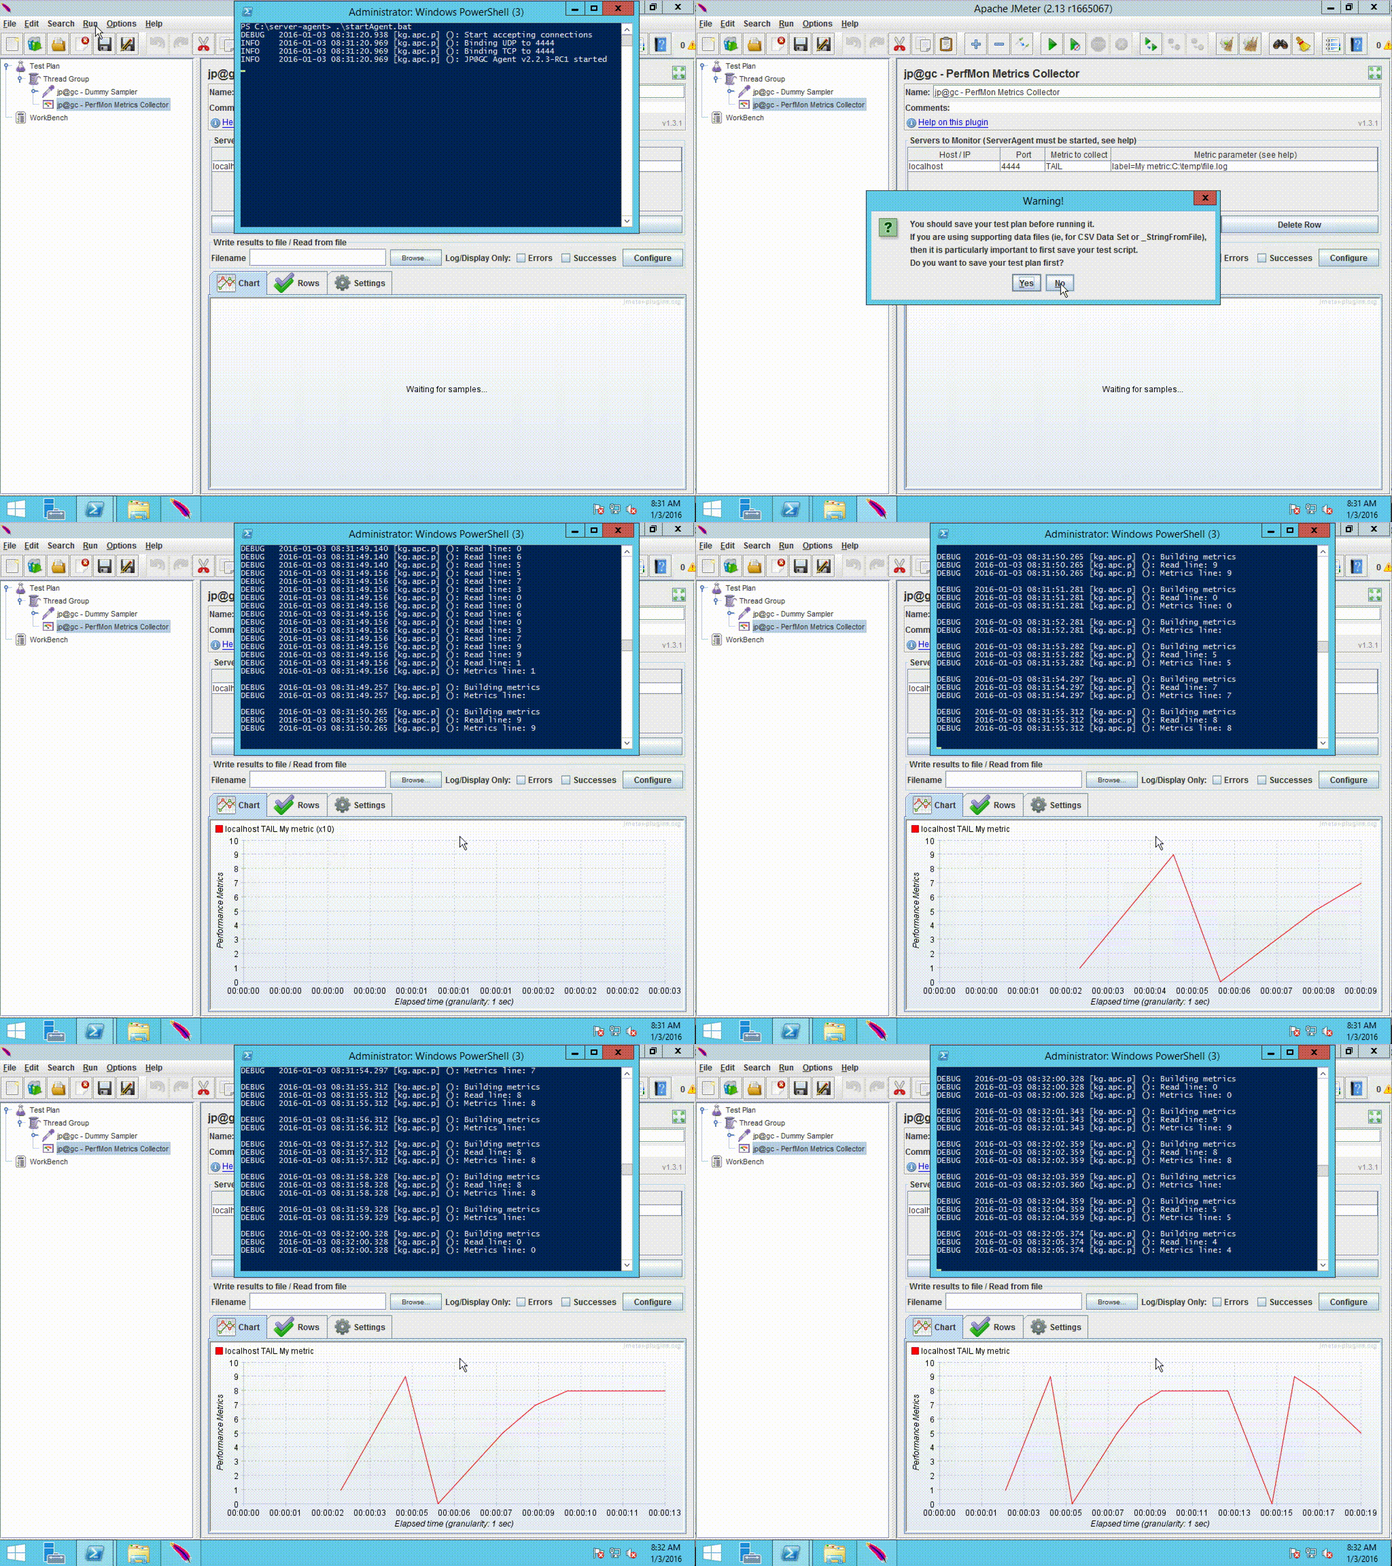
When you add a TAIL metric, the remote Server Agent will start reading the specified file and send the values back to the PerfMon Metrics Collector. You will then be able to view all the data in a chart.
2. EXEC
The EXEC metric enables the execution of an arbitrary command or program and sends the results back to the JMeter Metrics Collector. Just like the TAIL Metric, the command or program output will need to be a single numeric value so it can be represented in a chart.
The configuration is straightforward, you just need to enter the command you want to monitor into the Metric Parameter:
The format should be as follows:
command:first argument:second argument:etc
As you can see, the command (or program) and argument(s) need to be separated by colons. If your command path or argument contains a colon (like the Windows logical drive letter C: or D:) you’ll need to put a backslash before and after it. For example:
C\:\apache-jmeter
For my example, I want to visualize the output of the Windows command line %RANDOM% dynamic variable, which will return a random number between 0 and 32767. This is how my command looks:
C\:\Windows\System32\cmd.exe:/c:echo %RANDOM%
Let’s break this down:
- C\:\Windows\System32\cmd.exe. This is the command itself, in this case the Windows command-line interpreter
- /c. This is the cmd.exe command line switch which executes the command and terminates the interpreter instance
- echo %RANDOM%. The echo is a built-in cmd.exe command, which writes provided operands to a standard output. In my case, it will return a %RANDOM% variable value
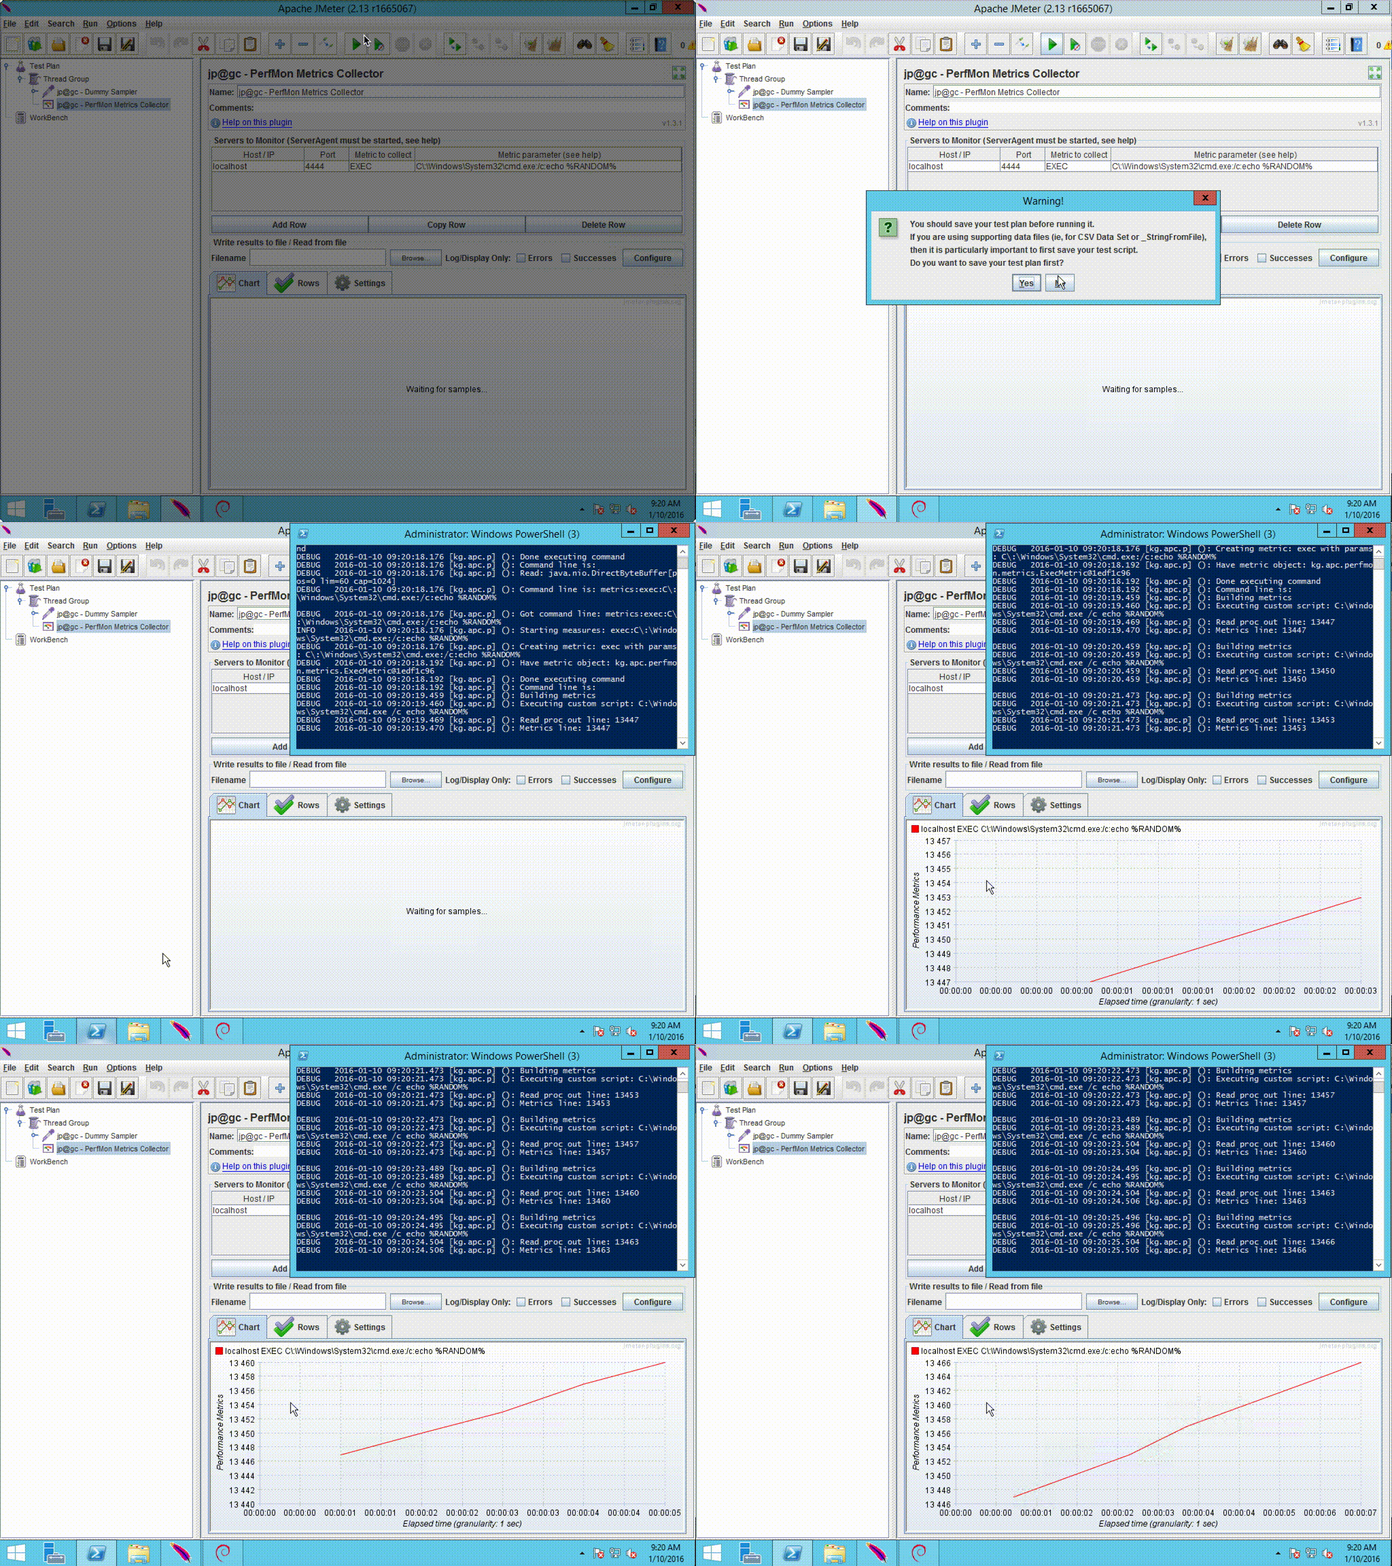
Now let’s see it in action:
As you can see, the Server Agent executes the command from the “Metric Parameters” input, and the Metrics Collector represents the received numeric value as a chart.
Just one word of warning: the EXEC metric opens a ‘big hole’. If someone else has access to your machine, they can easily execute any command there - be it accidentally or intentionally.
Back to top
How to Gather Advanced Analytics with JMeter Performance Metrics
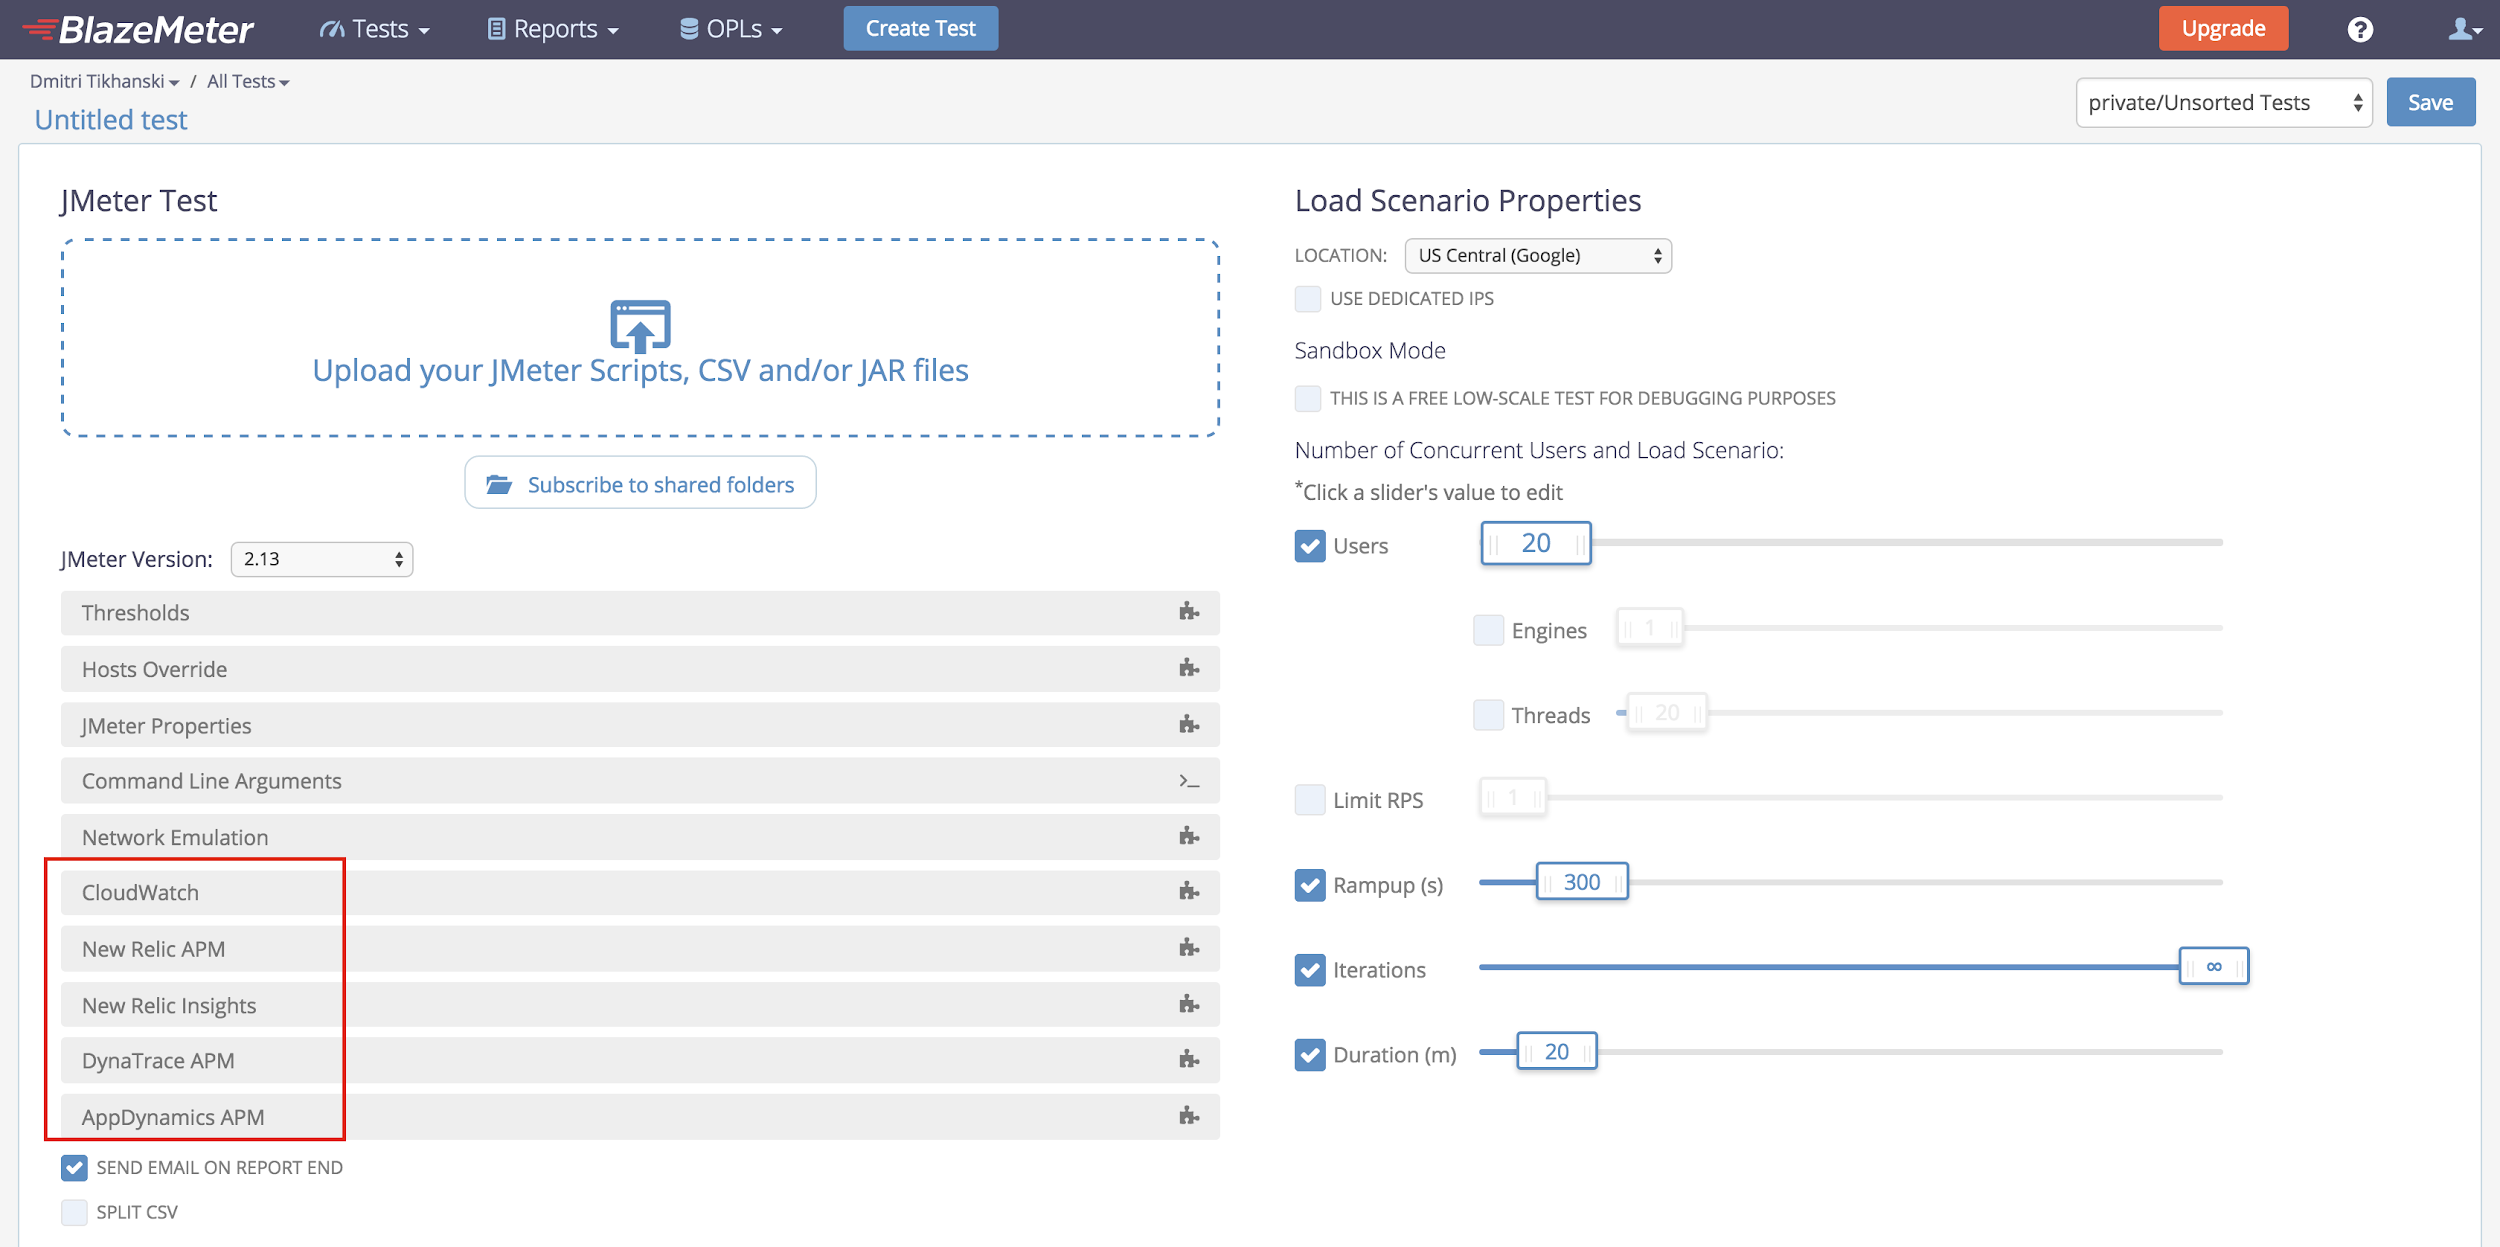
The BlazeMeter cloud fully supports PerfMon Metrics Collector listener.
Also, as BlazeMeter fully integrates with solutions like Amazon CloudWatch, NewRelic, DynaTrace, and AppDynamics, it’s easy to gather advanced analytics.
You can configure these integrations in just a couple of clicks - for any type of test.
I hope that this information has helped you better understand JMeter performance metrics and how to set up server side performance monitoring for your JMeter testing. Try adding these important metrics to your load test reports and let us know how it goes in the comments!


