Blog
October 17, 2024

Continuous Integration and Continuous Delivery (CI/CD) are important parts of the Software Development Life Cycle (SDLC). They are helpful for delivering new features or hotfixes to production without human intervention. When you commit new source code to the version control system a CI/CD server runs style checks, unit tests, integration tests, automated functional tests, and performance tests — determining if they all pass and a new version of the product gets deployed into production.
One of the most popular CI/CD solutions is Jenkins — a free and open source server which can automate any stage of your software delivery process.
In this blog, you will learn how to set up Jenkins test automation to kick off a performance test in BlazeMeter.
Preparing BlazeMeter
First, you need to create an API key so Jenkins can communicate with BlazeMeter, start a test, and get results.
If you do not have a BlazeMeter API key, you can create one from the BlazeMeter application main page.
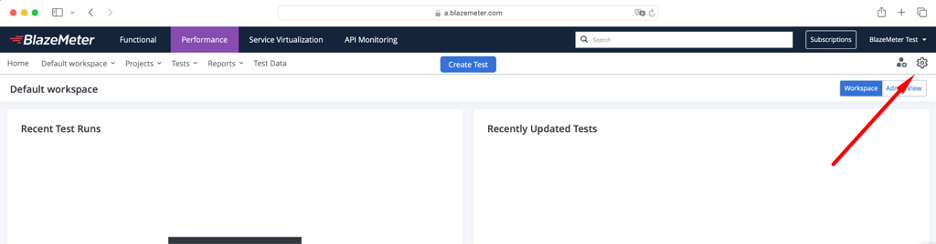
Click the gear icon in upper-right corner:
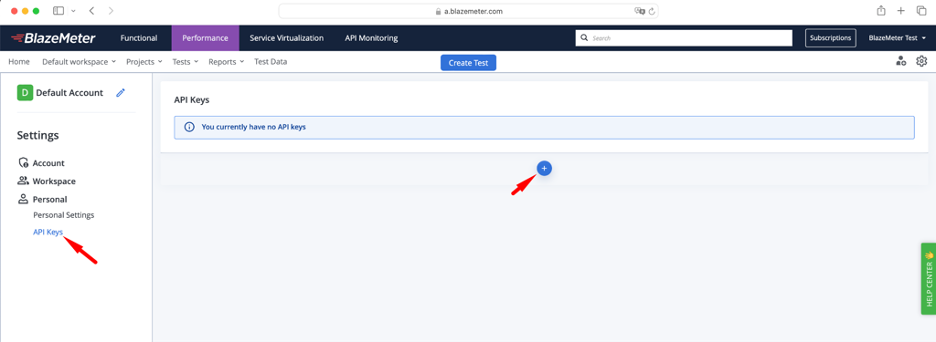
Click “API Keys” and blue plus icon:
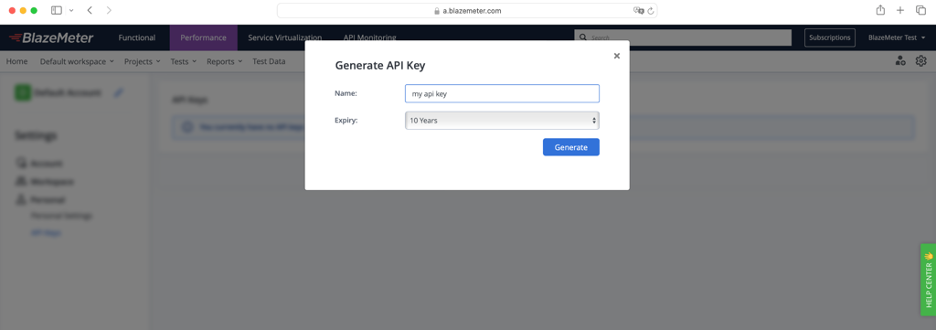
Provide a meaningful name and choose the key expiration date. Once the key is expired, you will not be able to use it anymore.
After you click the “Generate” button, you will see API Key ID and API Key Secret.
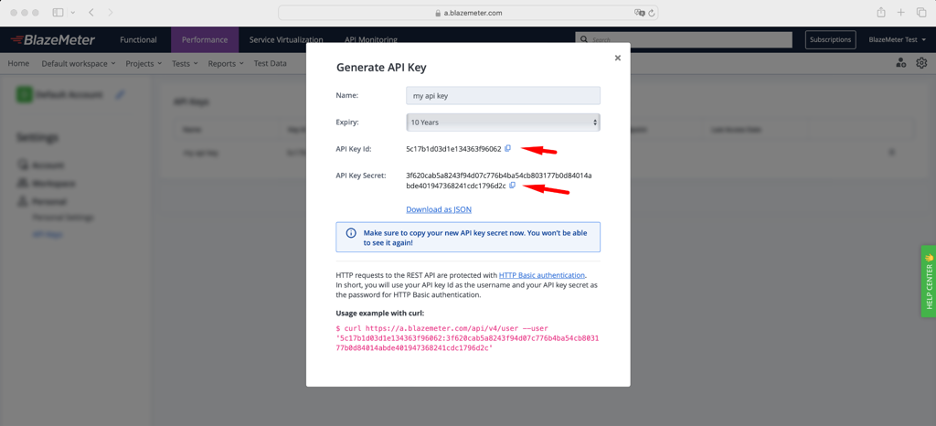
You will be able to see them only once, so make sure to record. It will not be possible to see them again. This key can be used for accessing BlazeMeter REST API and for using BlazeMeter Reporting Service in Taurus tool.
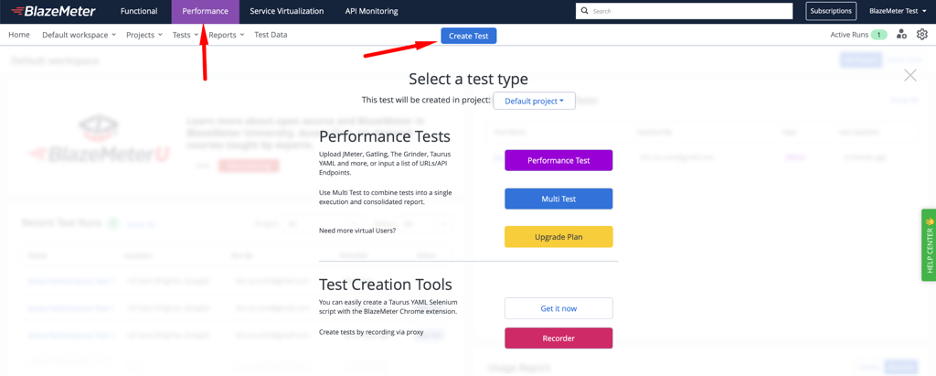
You will also need to have a BlazeMeter Performance Test in your account. If you do not yet have one, you can either upload your existing test or record a new one.
 Back to top
Preparing Jenkins Test Automation
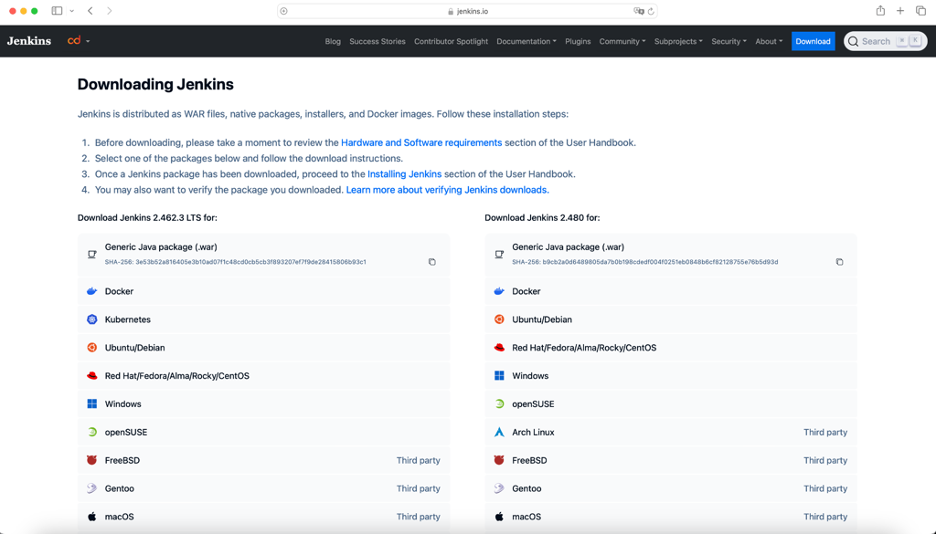
If you do not already have access to Jenkins, you can simply download Jenkins for your operating system or use “Generic Java Package” if you only want to experiment. It will result in a jenkins.war file that you will be able to run as java -jar jenkins.war.
After that, you should be able to access Jenkins using the following URL: http://localhost:8080.
Installation and configuration process is described in detail in the Your Guide To Jenkins Installation on Windows article.
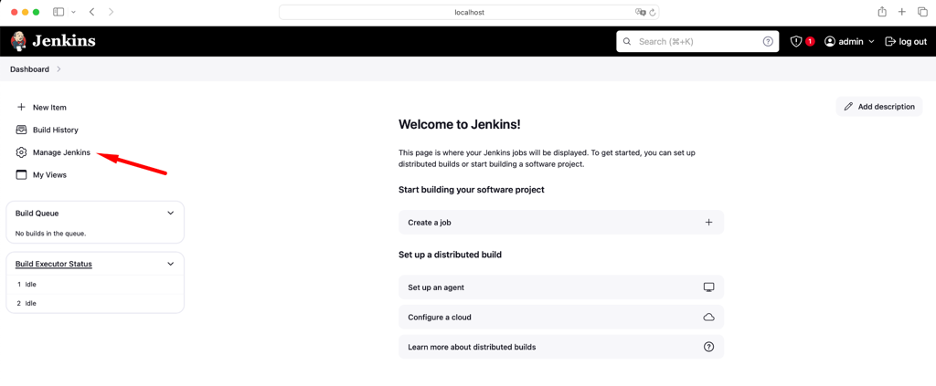
The next essential part is installing BlazeMeter’s plugin for Jenkins. The fastest and easiest way is using Jenkins Plugins Manager. From the Jenkins main page, click “Manage Jenkins.”
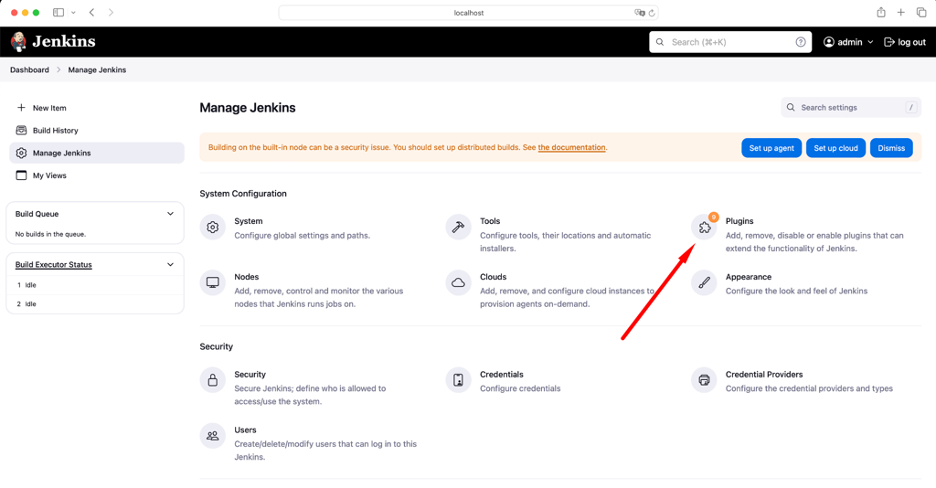
Then find “Plugins” section:
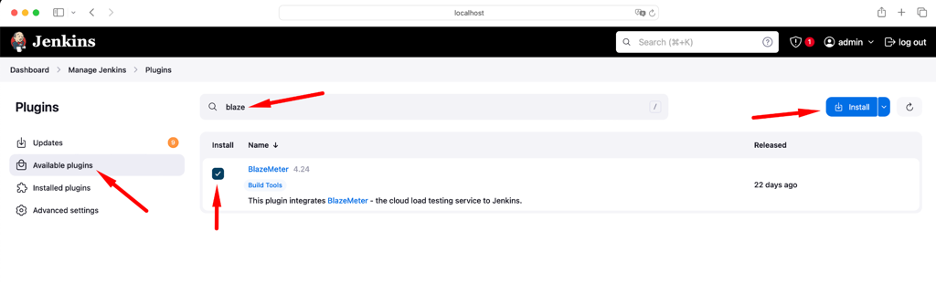
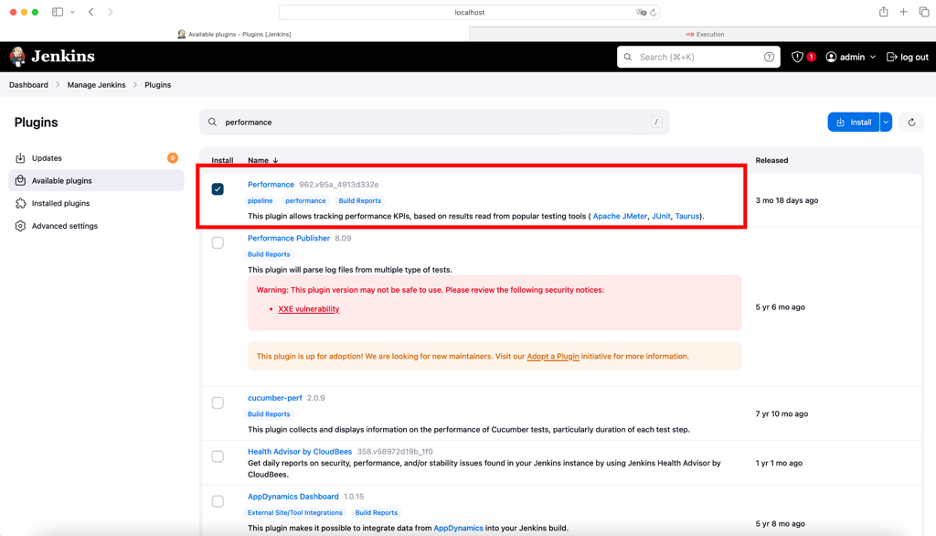
Switch to “Available Plugins” and start searching for BlazeMeter. When the BlazeMeter plugin appears in the search results, select the box in the “Install” column and click the blue “Install” button in the upper-right corner:
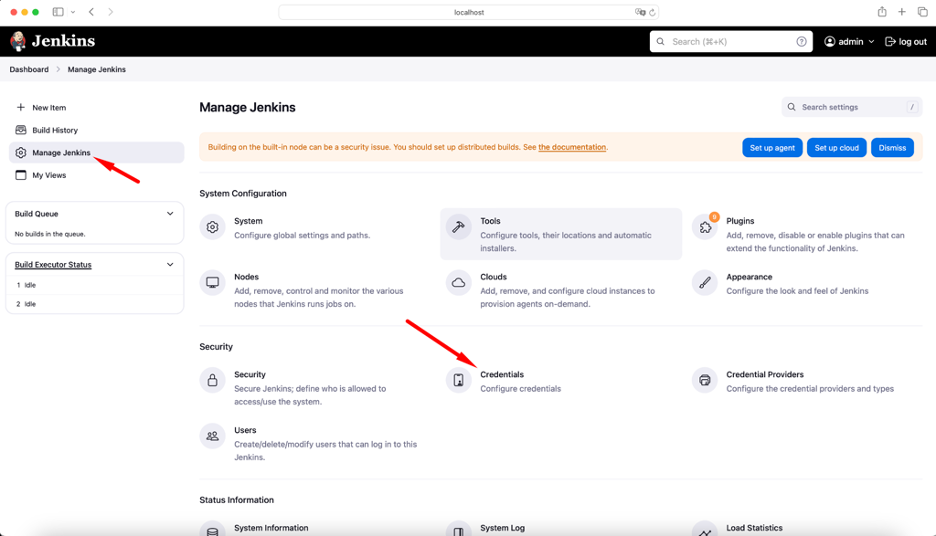
It is also required to set up Jenkins Credentials and provide your BlazeMeter API key. Again, open “Manage Jenkins” and click “Credentials”:
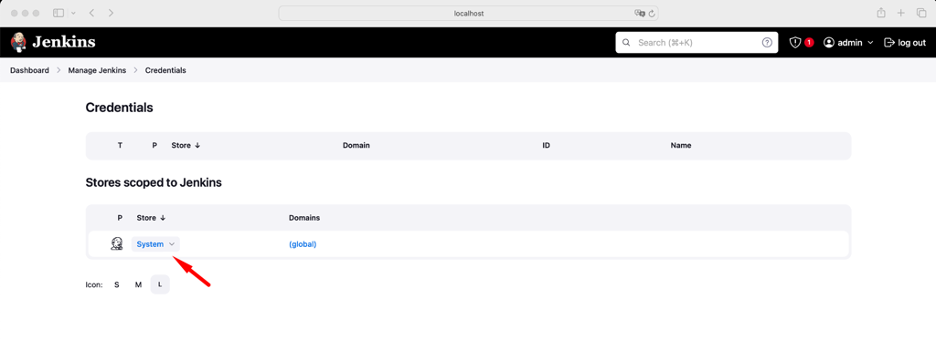
Click on “System” store:
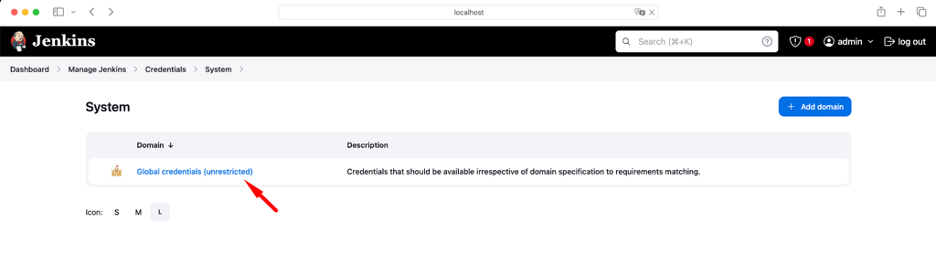
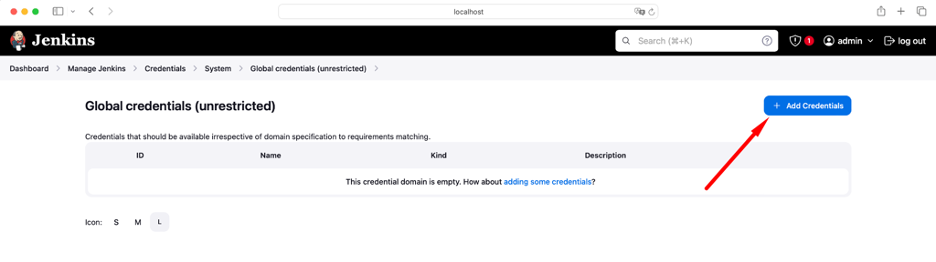
Click on “Global credentials (unrestricted)” domain:
Finally, “Add Credentials” button:
In the wizard, choose “BlazeMeter Credentials” as the “Kind”:
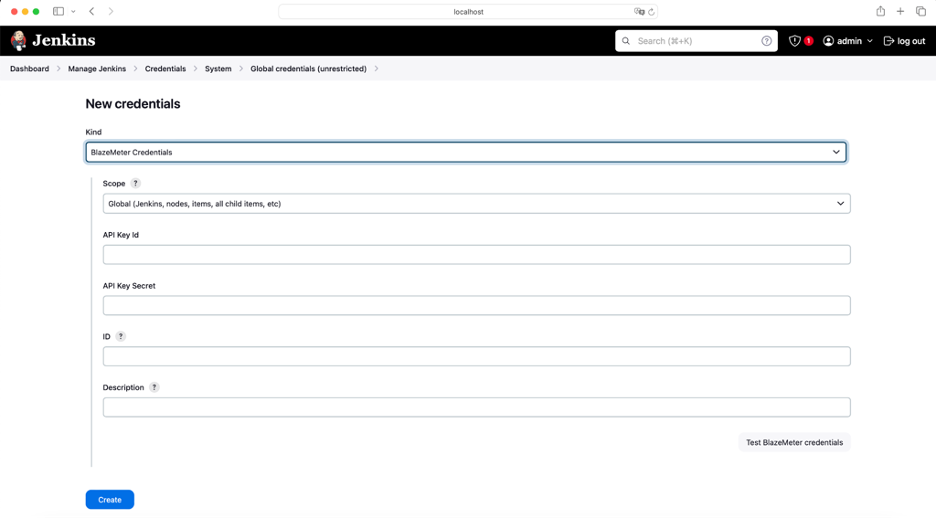
Provide the “API Key ID” and “API Key Secret” from your BlazeMeter account details page. It is also a good idea to provide a meaningful “Description” so you are able to distinguish BlazeMeter’s credentials from others:
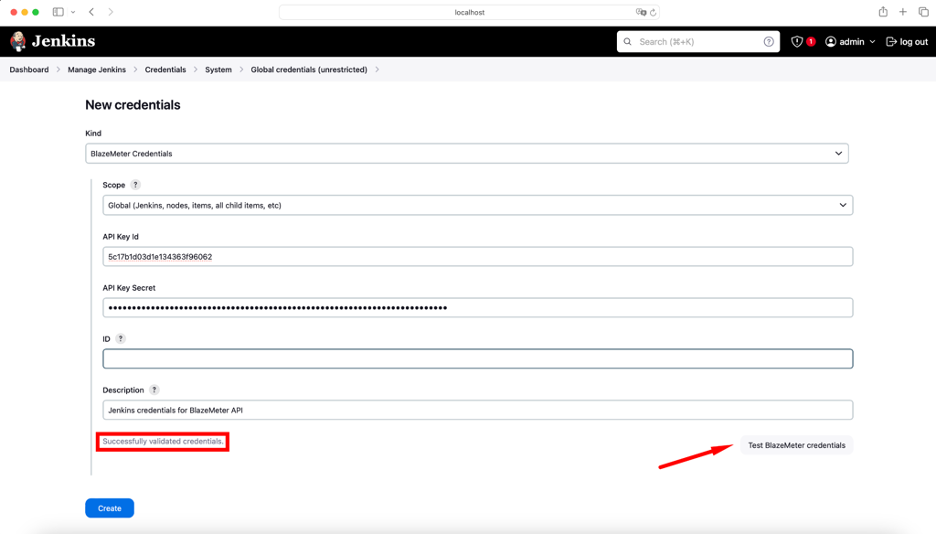
You can also use the “Test BlazeMeter credentials” button to verify credentials in particular and BlazeMeter API connectivity in general. If everything is fine, you should see “Successfully validated credentials” message.
Back to top
Creating a BlazeMeter Performance Test
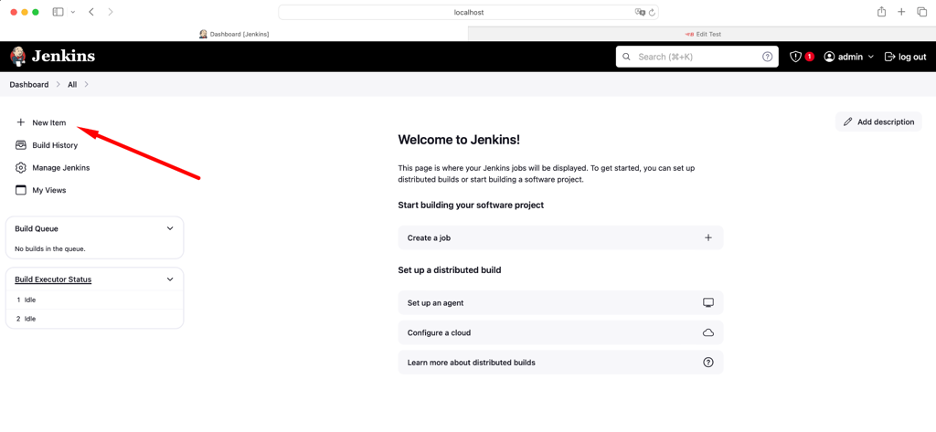
Now it is time to create a Jenkins job which will trigger a BlazeMeter test. To do so, select “New Item” from the Jenkins dashboard:
On the next step, provide a meaningful name and choose the job type:
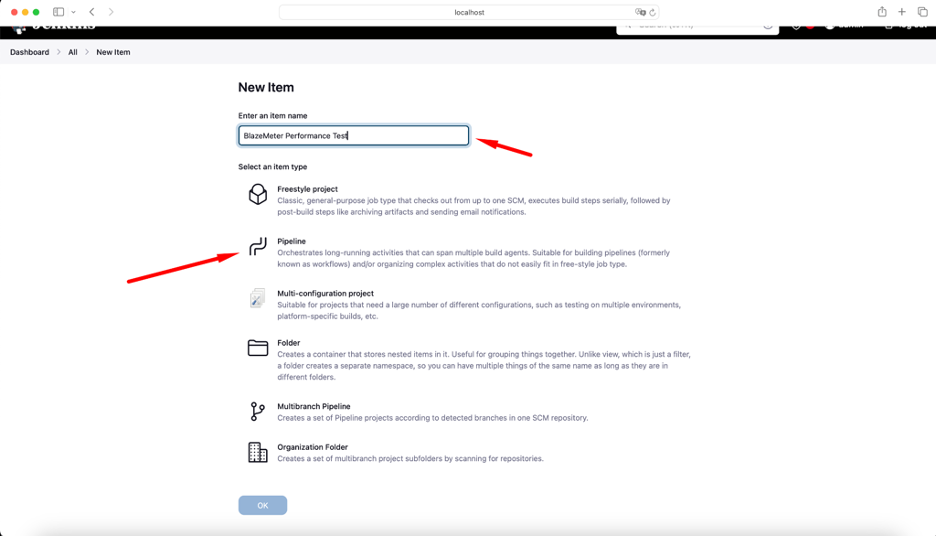
It makes sense to select “Pipeline.” Jenkins pipelines are Groovy scripts, so they can be transferred across instances, put under version control systems, commented and so on.
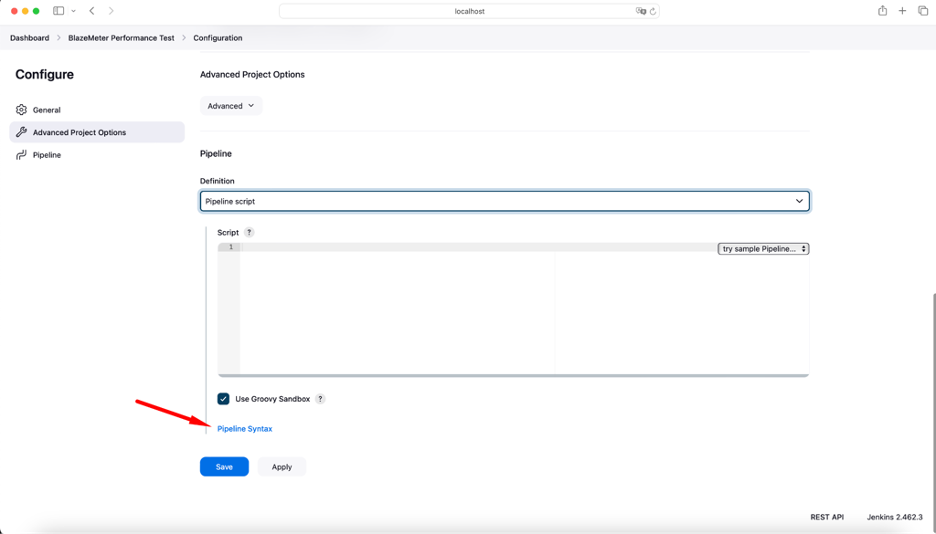
Do not worry: you do not have to know Groovy. It is possible to generate pipeline code using your browser. Scroll to the bottom of the page and click “Pipeline syntax” link:
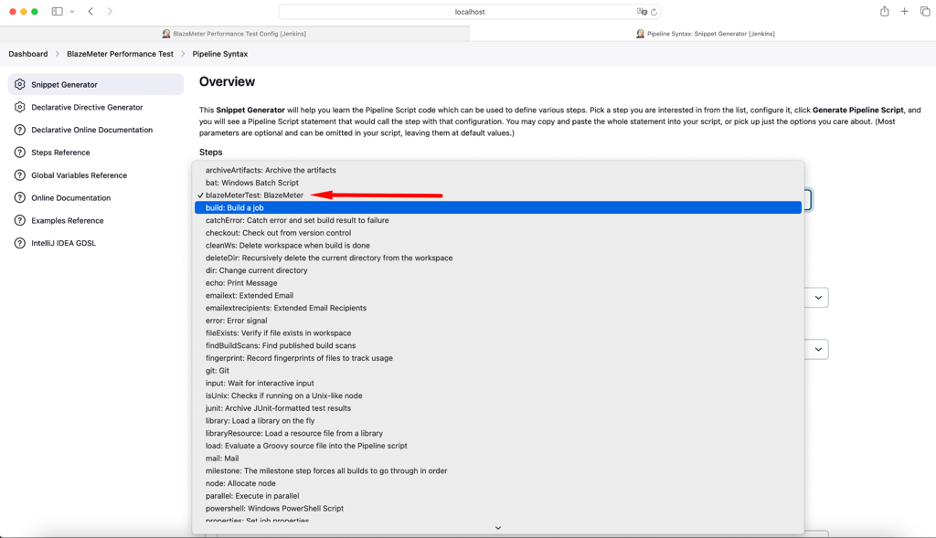
From the “Sample Step” dropdown choose, “blazeMeterTest: BlazeMeter”:
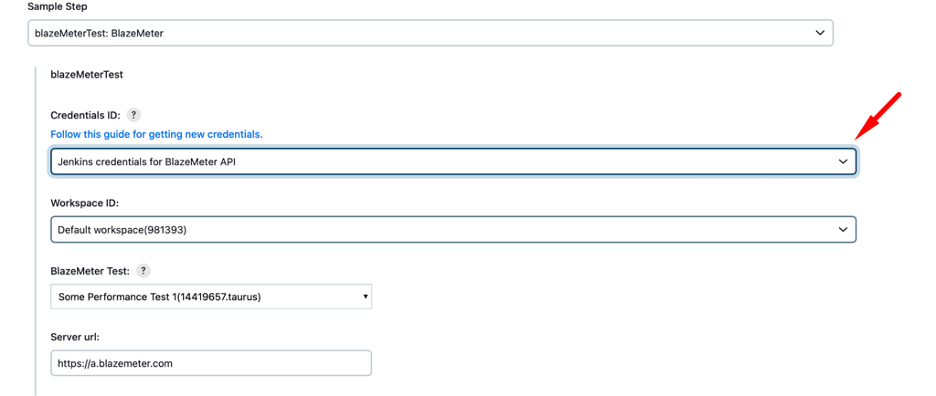
In “Credentials ID,” choose your BlazeMeter REST API credentials and Jenkins will load the list of your workspaces and tests. That means you will only need to choose the test you want to run:
Click “Generate Pipeline Script” button and Jenkins will come up with a Groovy code for running your BlazeMeter Test:
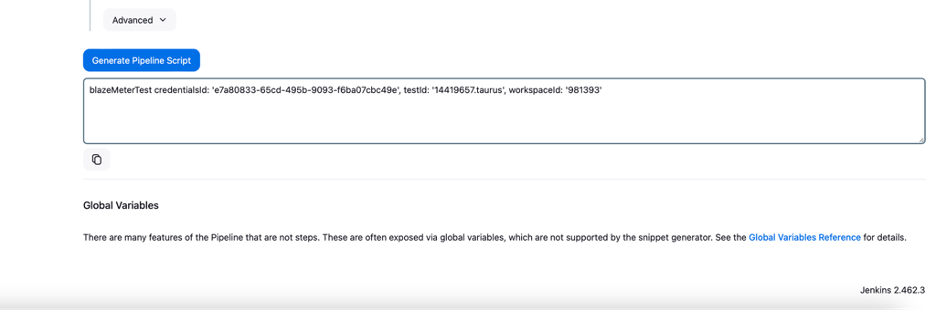
Copy and paste it into the pipeline script section:
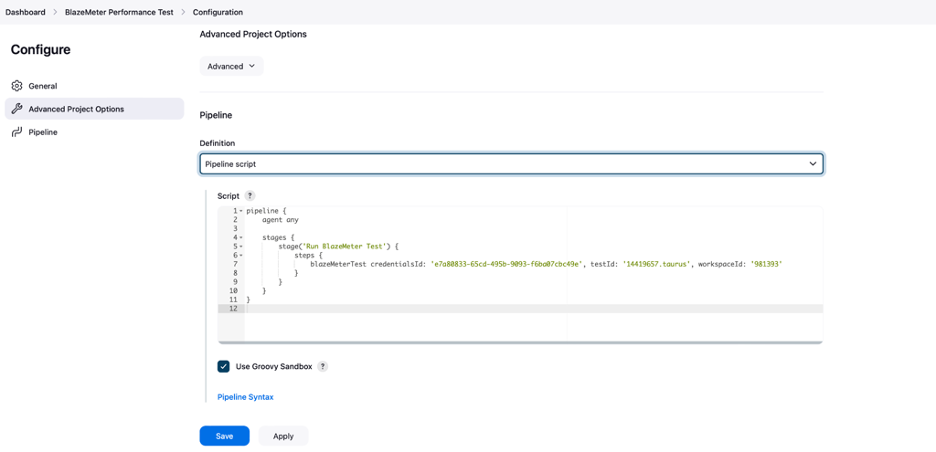
Here is the text version for your convenience:
pipeline {
   agent any

   stages {
       stage('Run BlazeMeter Test') {
           steps {
              blazeMeterTest credentialsId: 'e7a80833-65cd-495b-9093-f6ba07cbc49e', testId: '14419657.taurus', workspaceId: '981393'
           }
       }
   }
}
Now you can finally run your performance test. Click the “Build Now” button and it will trigger the Jenkins job:
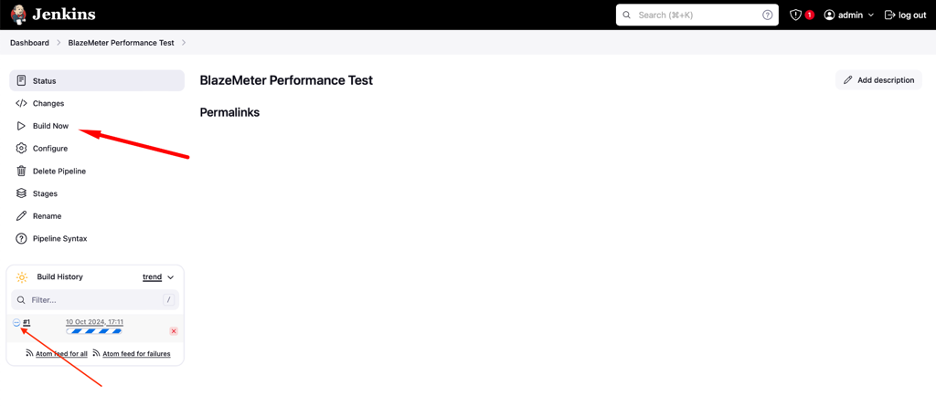
You can click the round icon left of the build number to see the console output where you can observe test progress:
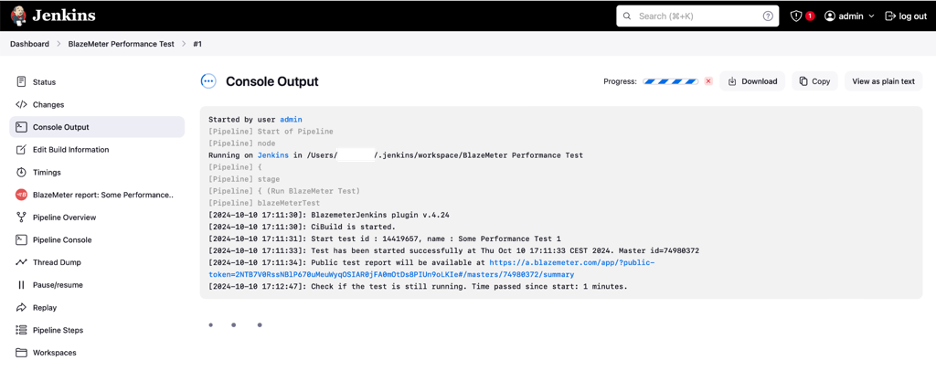
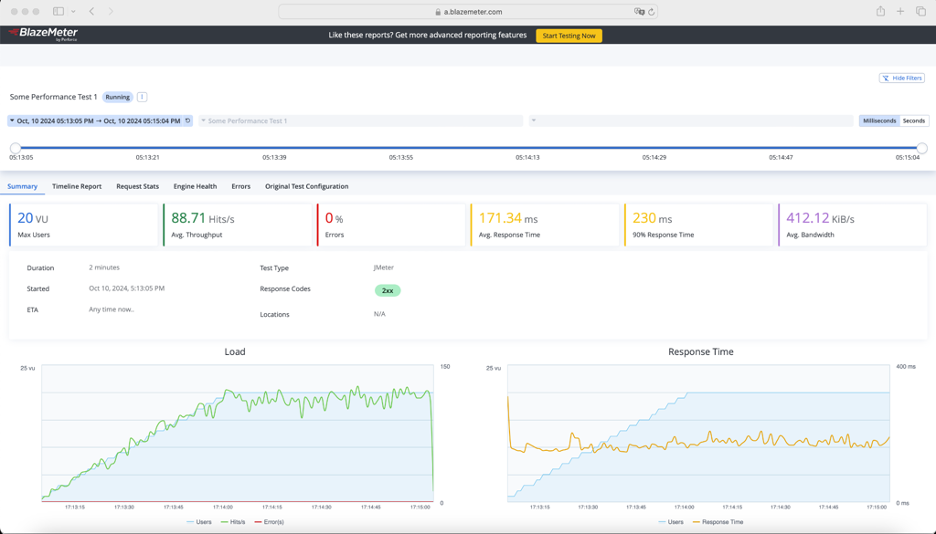
There you will see the link to the BlazeMeter online interactive report where you will be able to monitor your test in real-time:
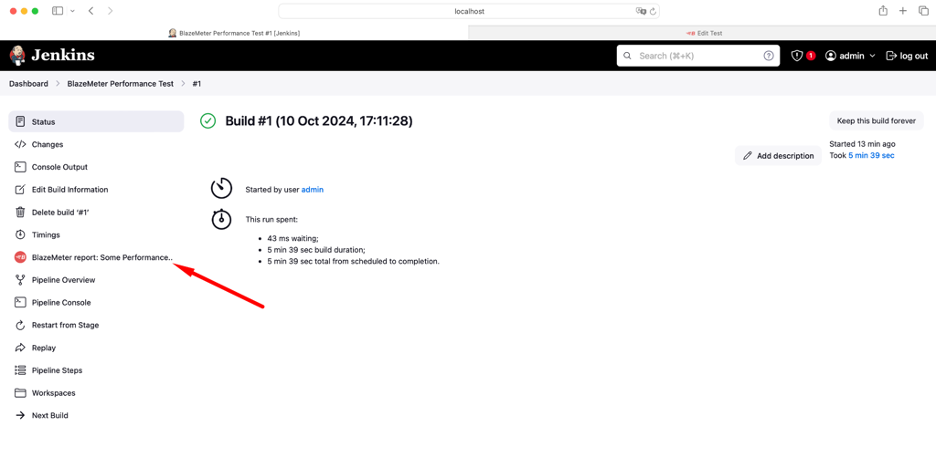
That pretty much does it! All you need to do is sit back, relax and wait for the build's completion. Once the test finishes, you will see the “BlazeMeter report” link that can be used for your test analysis.
 Back to top
Further Jenkins Test Automation Considerations
So far, we have established how to trigger a BlazeMeter test from your Jenkins pipelines. Now, let us install another plugin called Performance Plugin. This can generate performance trend charts and apply pass/fail criteria to test results.
Installation is exactly the same as for BlazeMeter plugin for Jenkins:
Once the plugin is installed and Jenkins is restarted, you can generate a performance report. To do this, you need to amend your pipeline a little bit.
First, configure BlazeMeter plugin to store JTL results file in the build’s workspace:
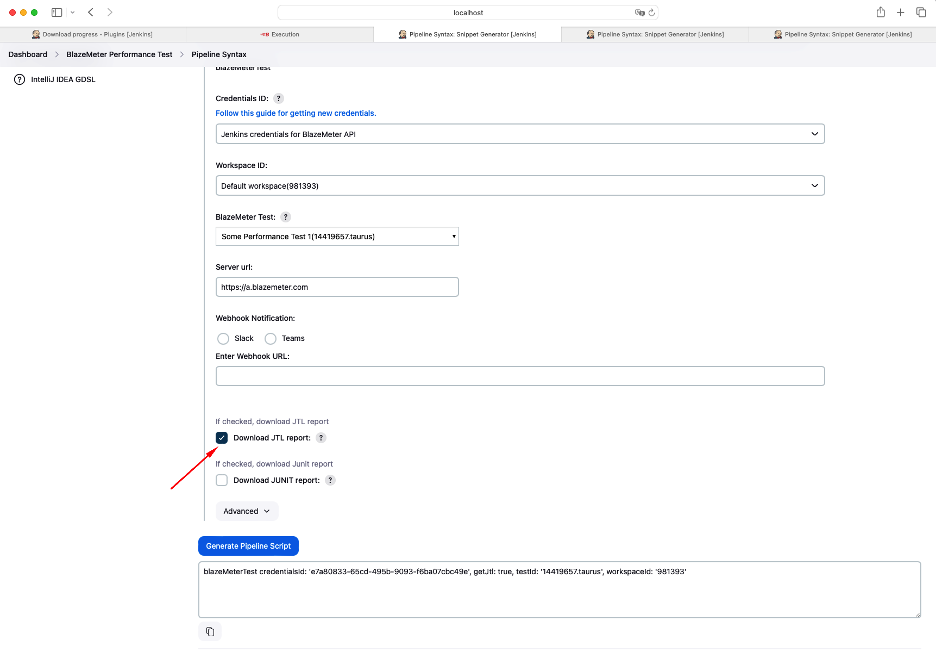
It will result in the getJtl: true parameter.
For the Performance Plugin, you need to point it to the JTL results file:
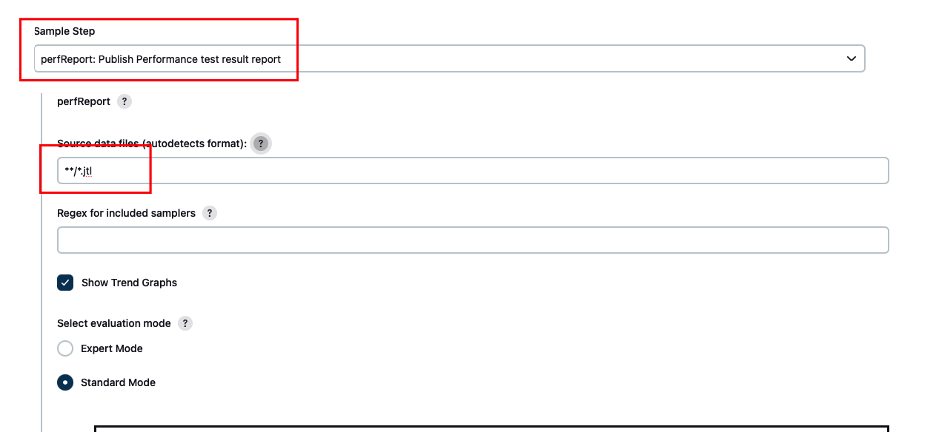
Now your full pipeline should look like this (remember to replace credentials, test and workspace IDs with your own):
pipeline {
agent any
stages {
stage('Run BlazeMeter Test') {
steps {
blazeMeterTest credentialsId: 'e7a80833-65cd-495b-9093-f6ba07cbc49e', testId: '14419657.taurus', workspaceId: '981393', getJtl: true
}
}
}
post {
always {
perfReport filterRegex: '', showTrendGraphs: true, sourceDataFiles: '**/*.jtl'
}
}
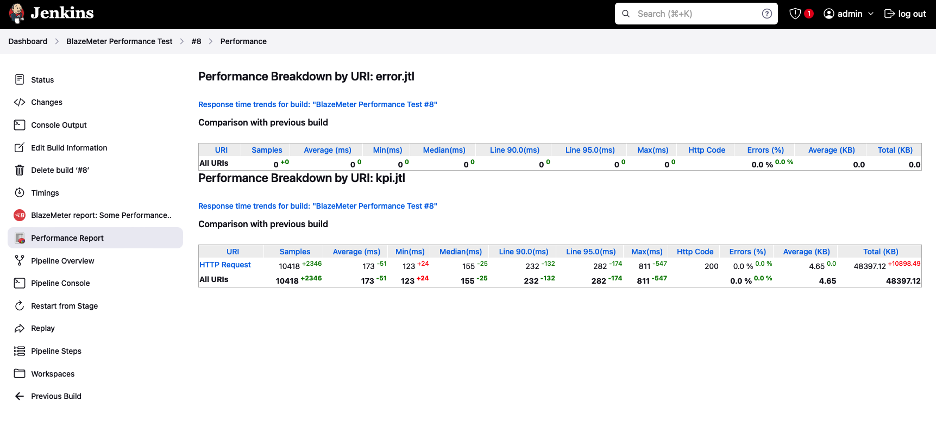
}After you run one more test, you should see the “Performance Report” button on your build’s dashboard:
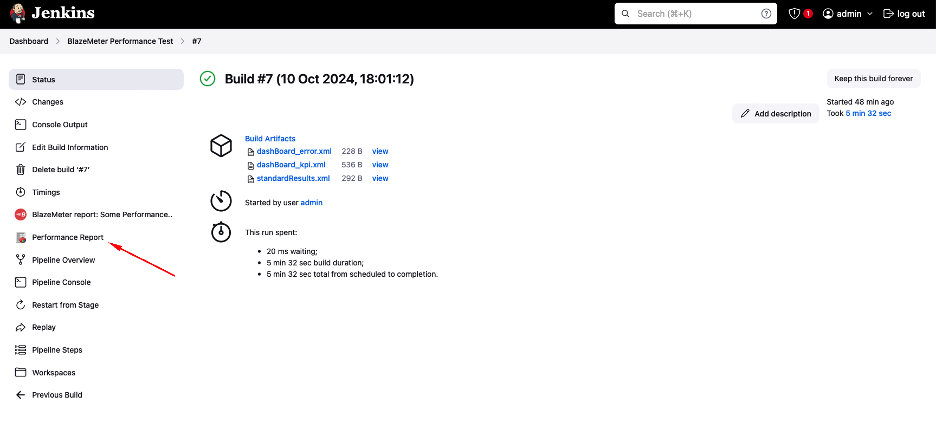
This contains metrics and KPIs for the current build and comparison with the previous build (if any):
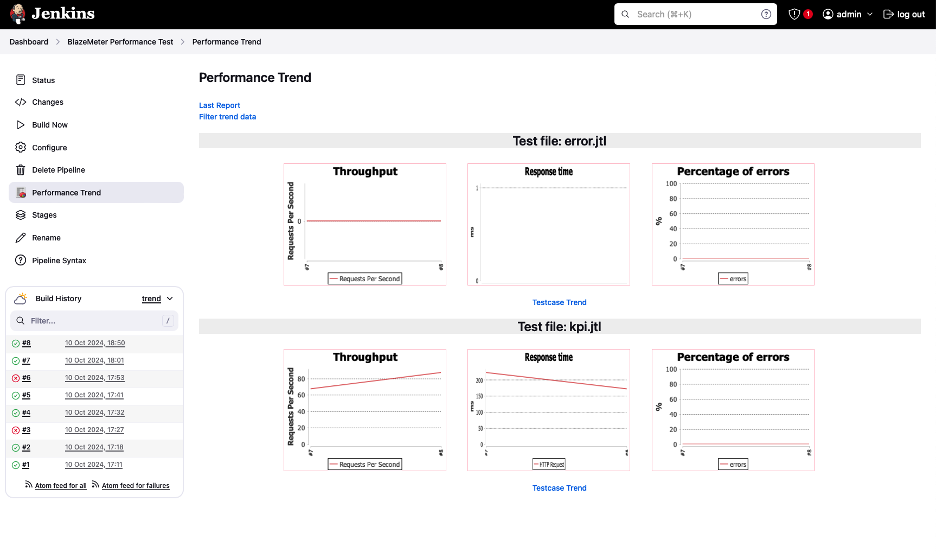
When you run one more build at the pipeline dashboard, you will see Performance Trend button:
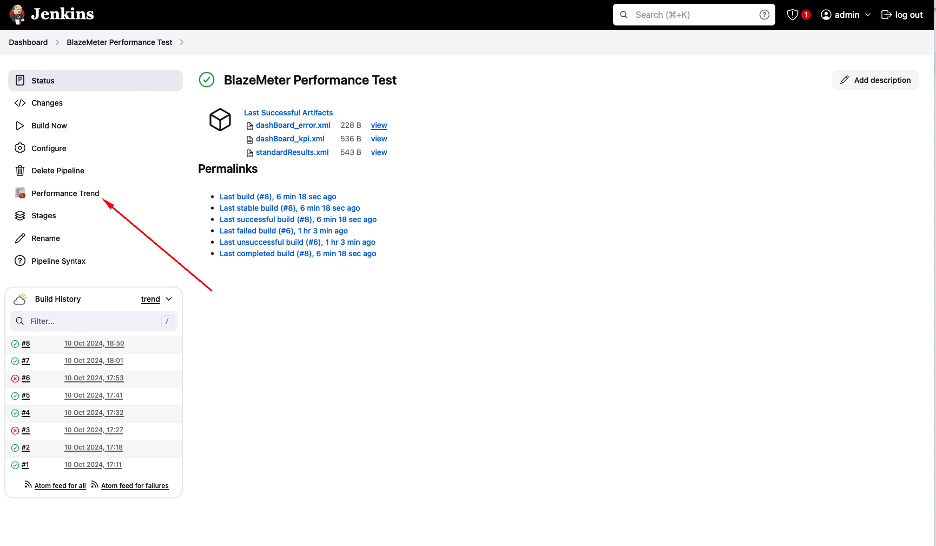
This will contain a chart showing how response times, throughput (number of requests per second), and percentage of errors change from build to build:
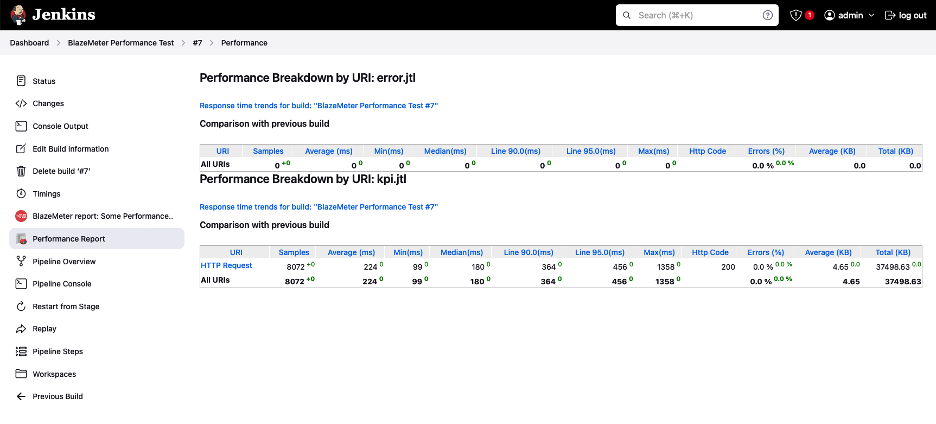
If you go to “Performance Report,” you will see how the metrics compare with the previous build:
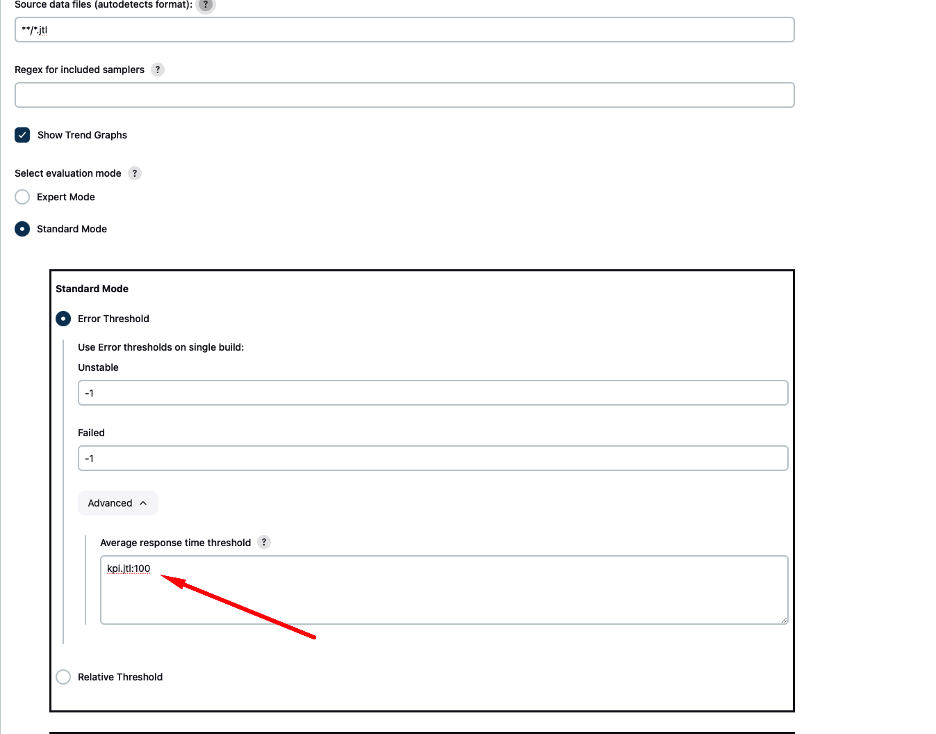
Now, let us tell Jenkins that we want to mark builds with average response time over 100 milliseconds as UNSTABLE. For this, amend testReport configuration as follows:
The full pipeline should look like:
pipeline {
   agent any

   stages {
       stage('Run BlazeMeter Test') {
           steps {
              blazeMeterTest credentialsId: 'e7a80833-65cd-495b-9093-f6ba07cbc49e', testId: '14419657.taurus', workspaceId: '981393', getJtl: true
           }
       }
   }
   post {
       always {
           perfReport errorUnstableResponseTimeThreshold: 'kpi.jtl:100', filterRegex: '', showTrendGraphs: true, sourceDataFiles: '**/*.jtl'
       }
   }
}
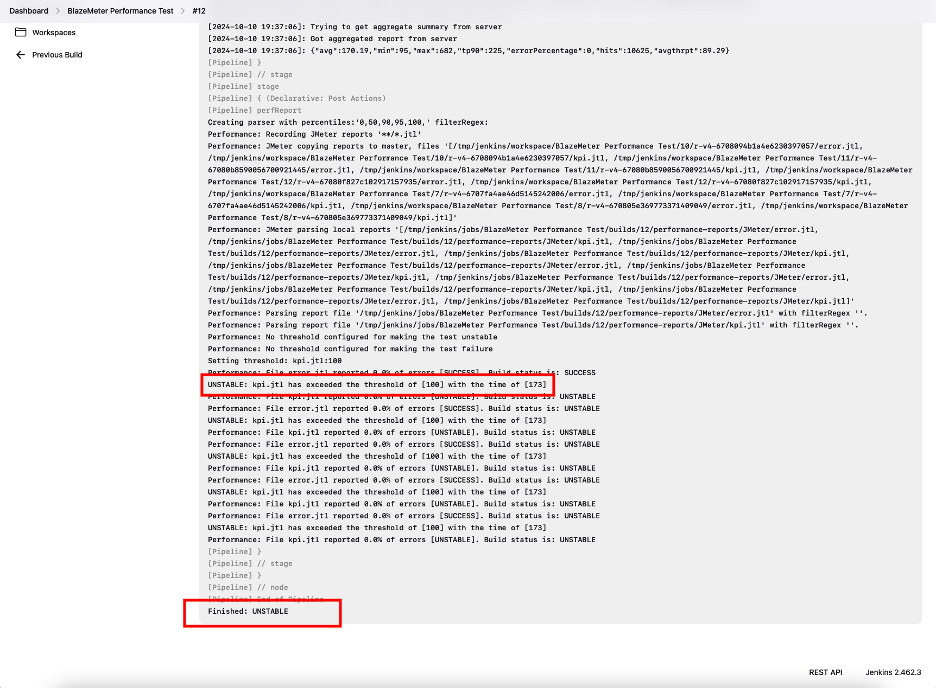
Now when you run your test and average response time exceeds 100 milliseconds, the build will not pass:
 Back to top
Bottom Line
You are now an expert on how to use Jenkins test automation with BlazeMeter’s performance tests!
Get the most out of your Jenkins tests — or any tests, for that matter — with BlazeMeter’s unrivaled power and flexibility. The best part? You can get started testing for FREE today!
Related Resources: